eBPF Cilium combat (2) - underlying network observability
In the previous platform, the network flow between components did not have direct observability. If there is a problem in the communication between user components, you can only manually check through traditional command line tools, while cilium's Hubble service can Provides a UI interface to display real-time traffic status to users, and exposes these indicators to Prometheus for aggregation and sorting, allowing users to observe and monitor the underlying network status more intuitively.
Enable Hubble UI service
The network observability of cilium is provided by the Hubble service. When cilium is installed, Hubble will not be installed by default. You can enable the Hubble service with the following command
helm upgrade cilium cilium/cilium --version 1.11.2 \
   --namespace kube-system \
   --reuse-values \
   --set hubble.relay.enabled=true \
   --set hubble.ui.enabled= true
Once the deployment is complete, the status can be determined by the following command
$ kubectl get po -n kube-system |grep hubble
hubble-relay-65ff5f9bf6-247pt 1/1 Running 0 5d19h
hubble-ui-5f7cdc86c7-gq5hs 3/3 Running 0 5d19h
$ kubectl get svc -n kube-system | grep hubble
hubble-relay ClusterIP 10.43.73.95    <none>        80/TCP 5d19h
hubble-ui ClusterIP 10.43.20.190   <none>        80/TCP 5d19h
After the deployment of Hubble is completed, the outside of the cluster cannot be accessed directly. You can enable external access in the following ways
-
Temporarily open
When executing the command, you can access the UI interface through
IP: 12000, and you cannot continue to access after exiting the commandcilium hubble ui -
long-term open
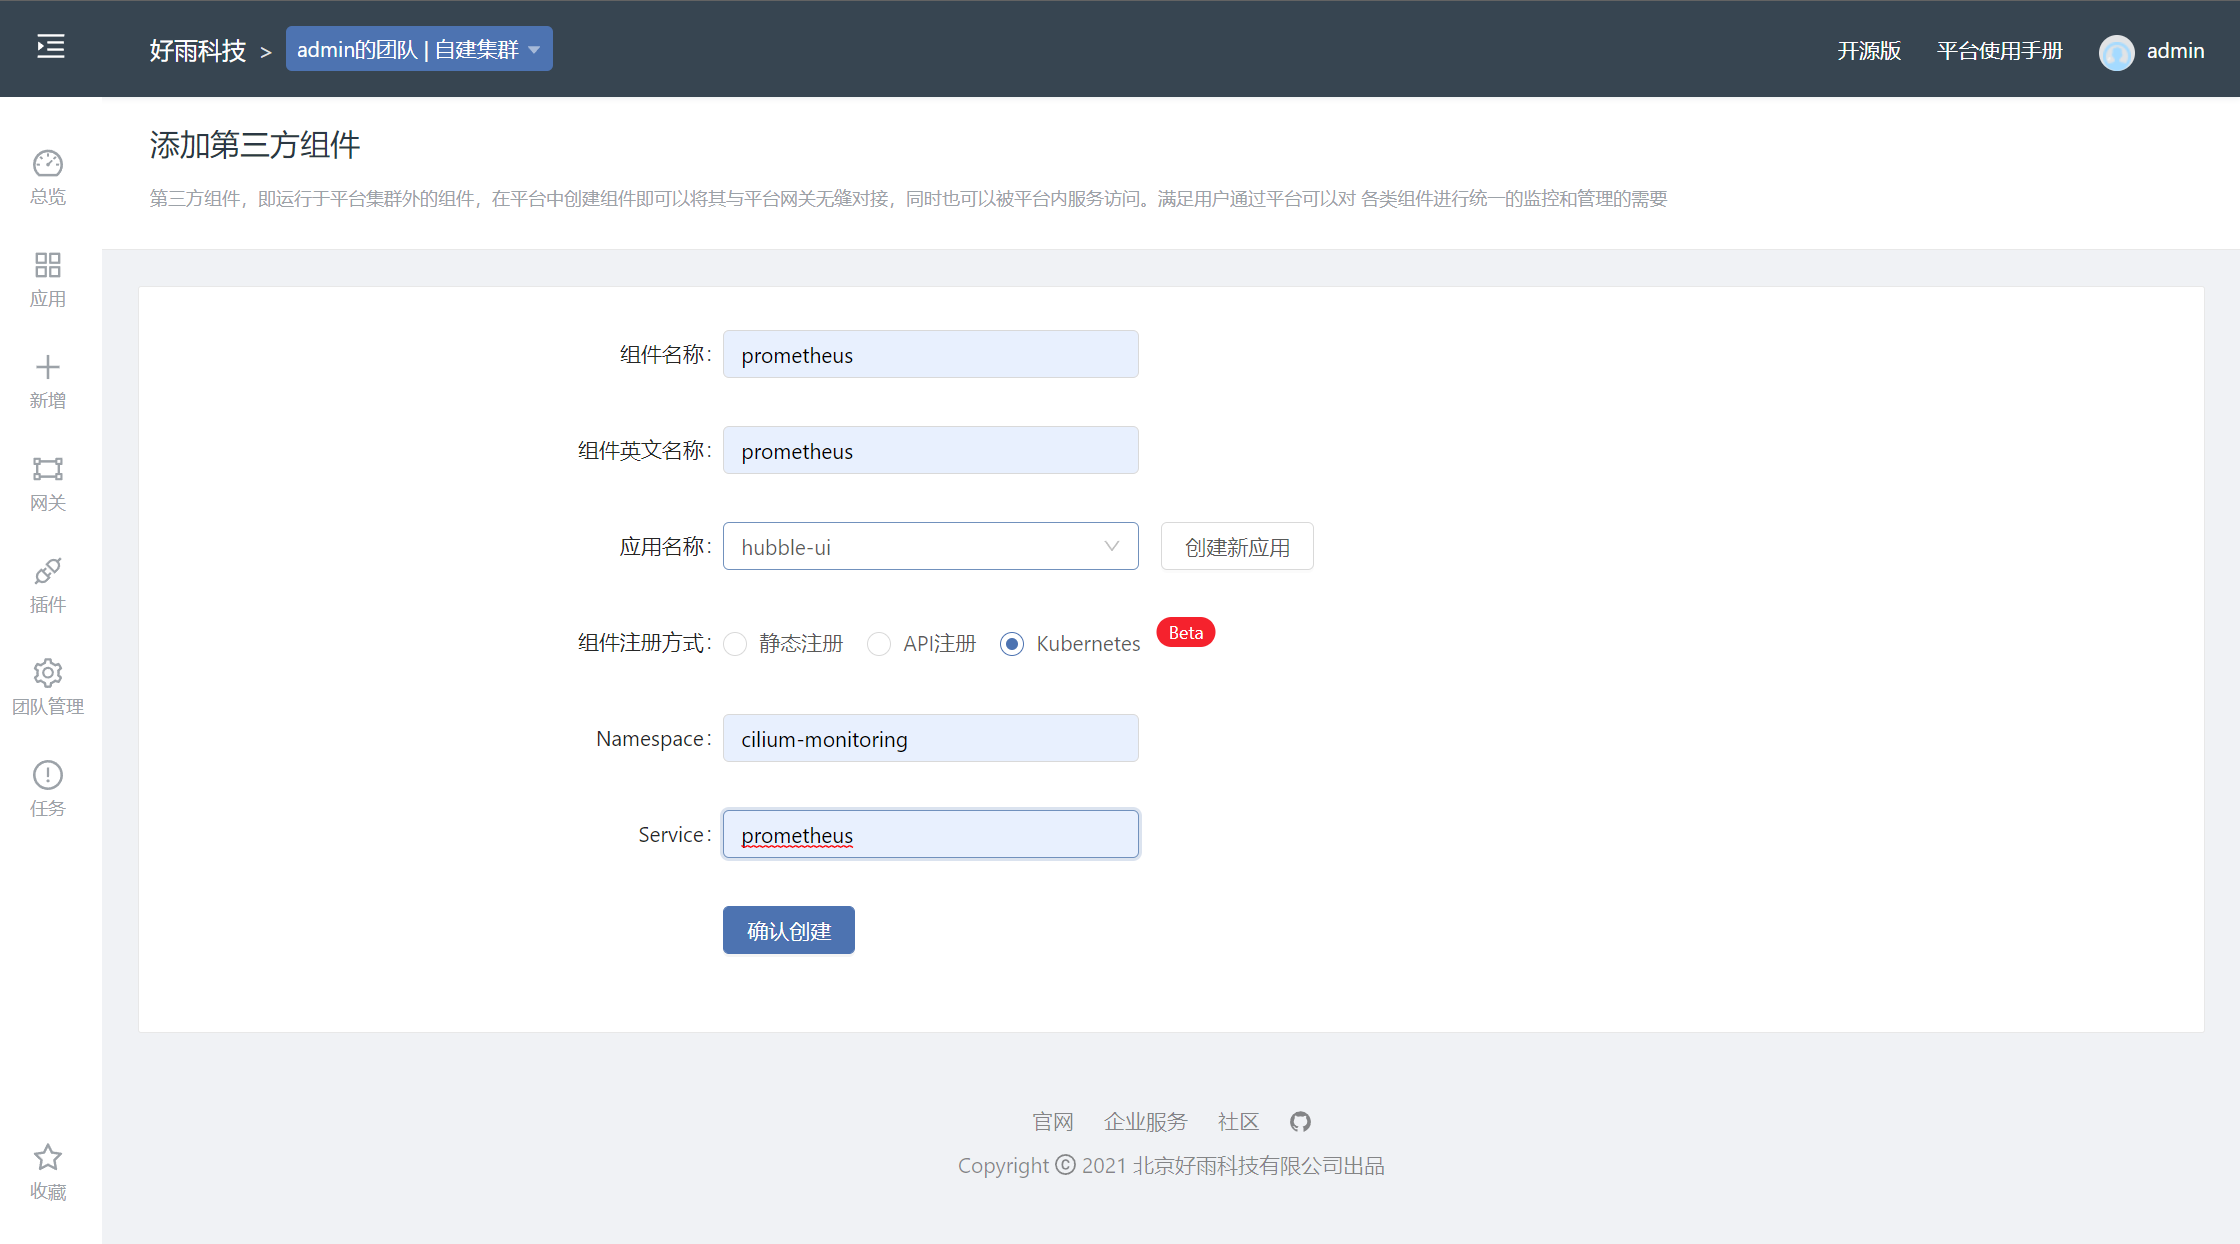
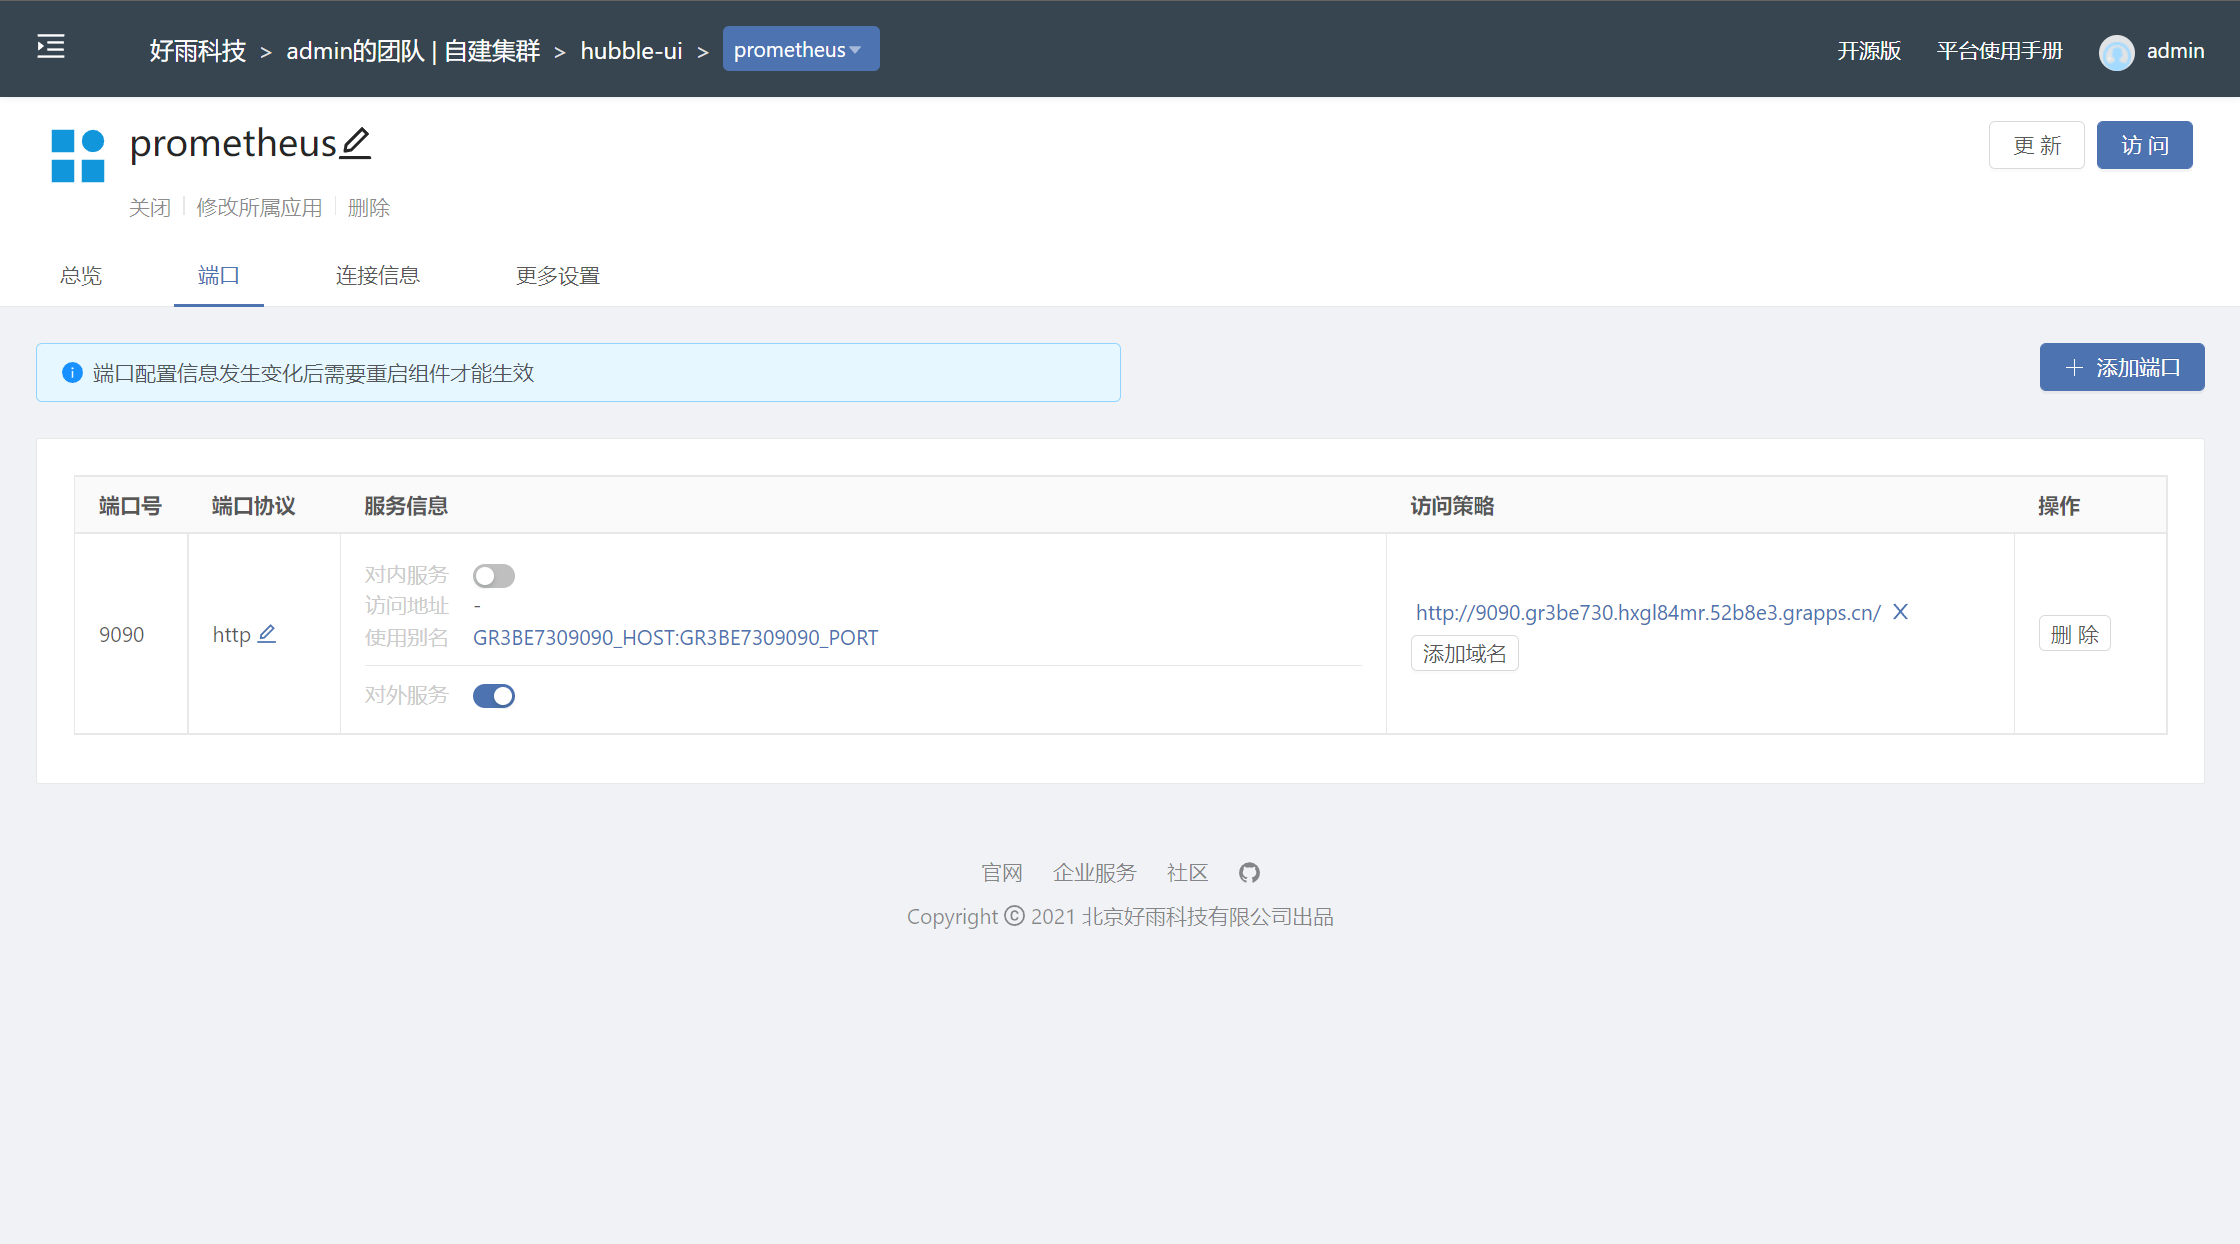
By adding third-party components through the Rainbond platform, you can open or close the access entry of the UI interface at any time
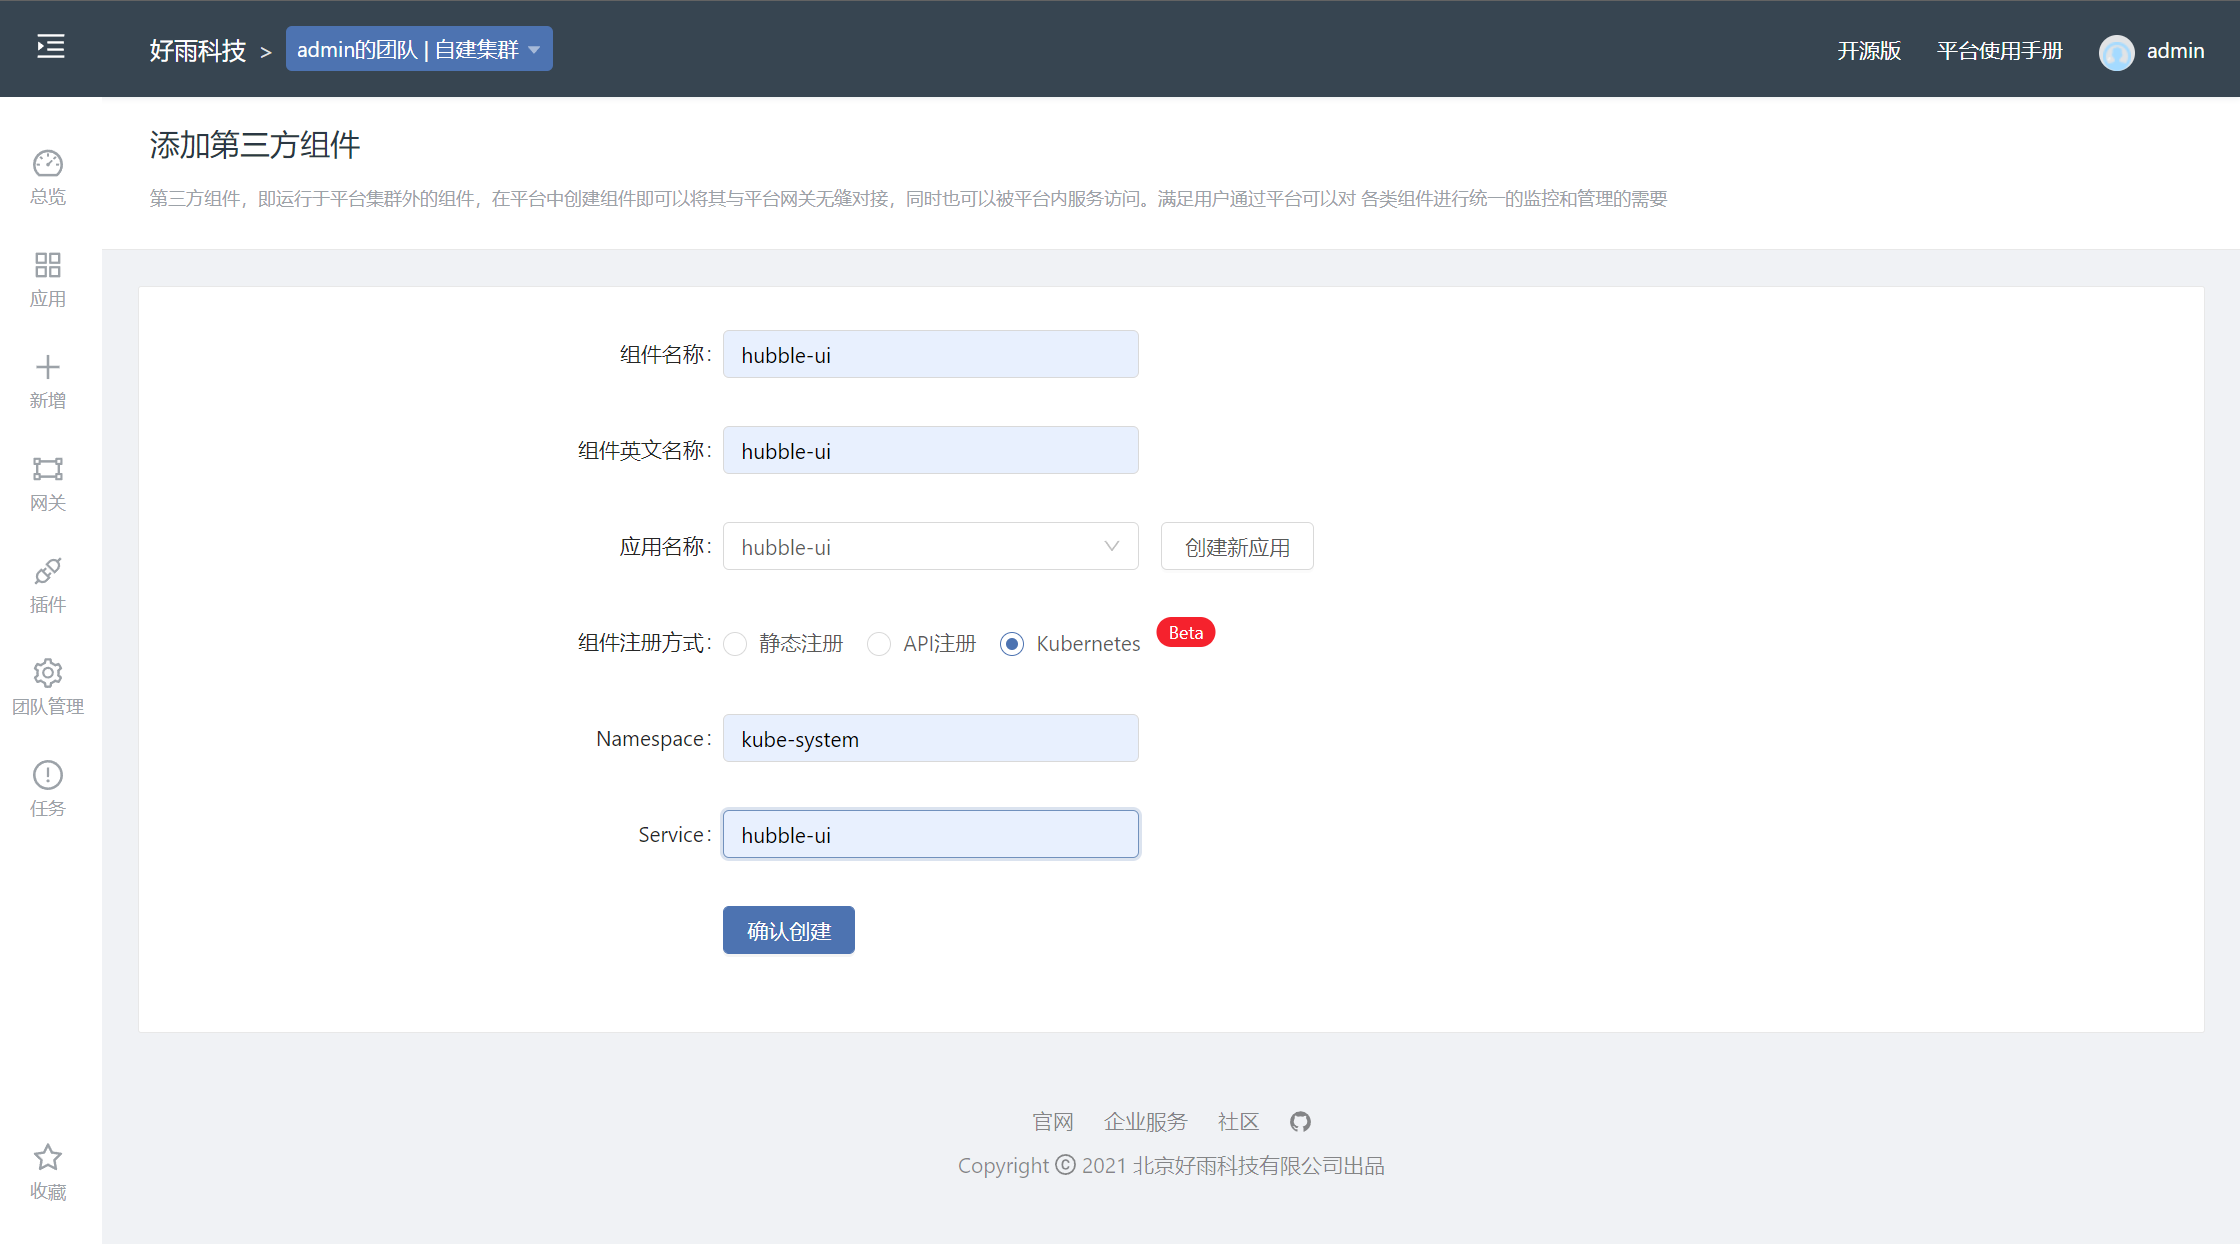
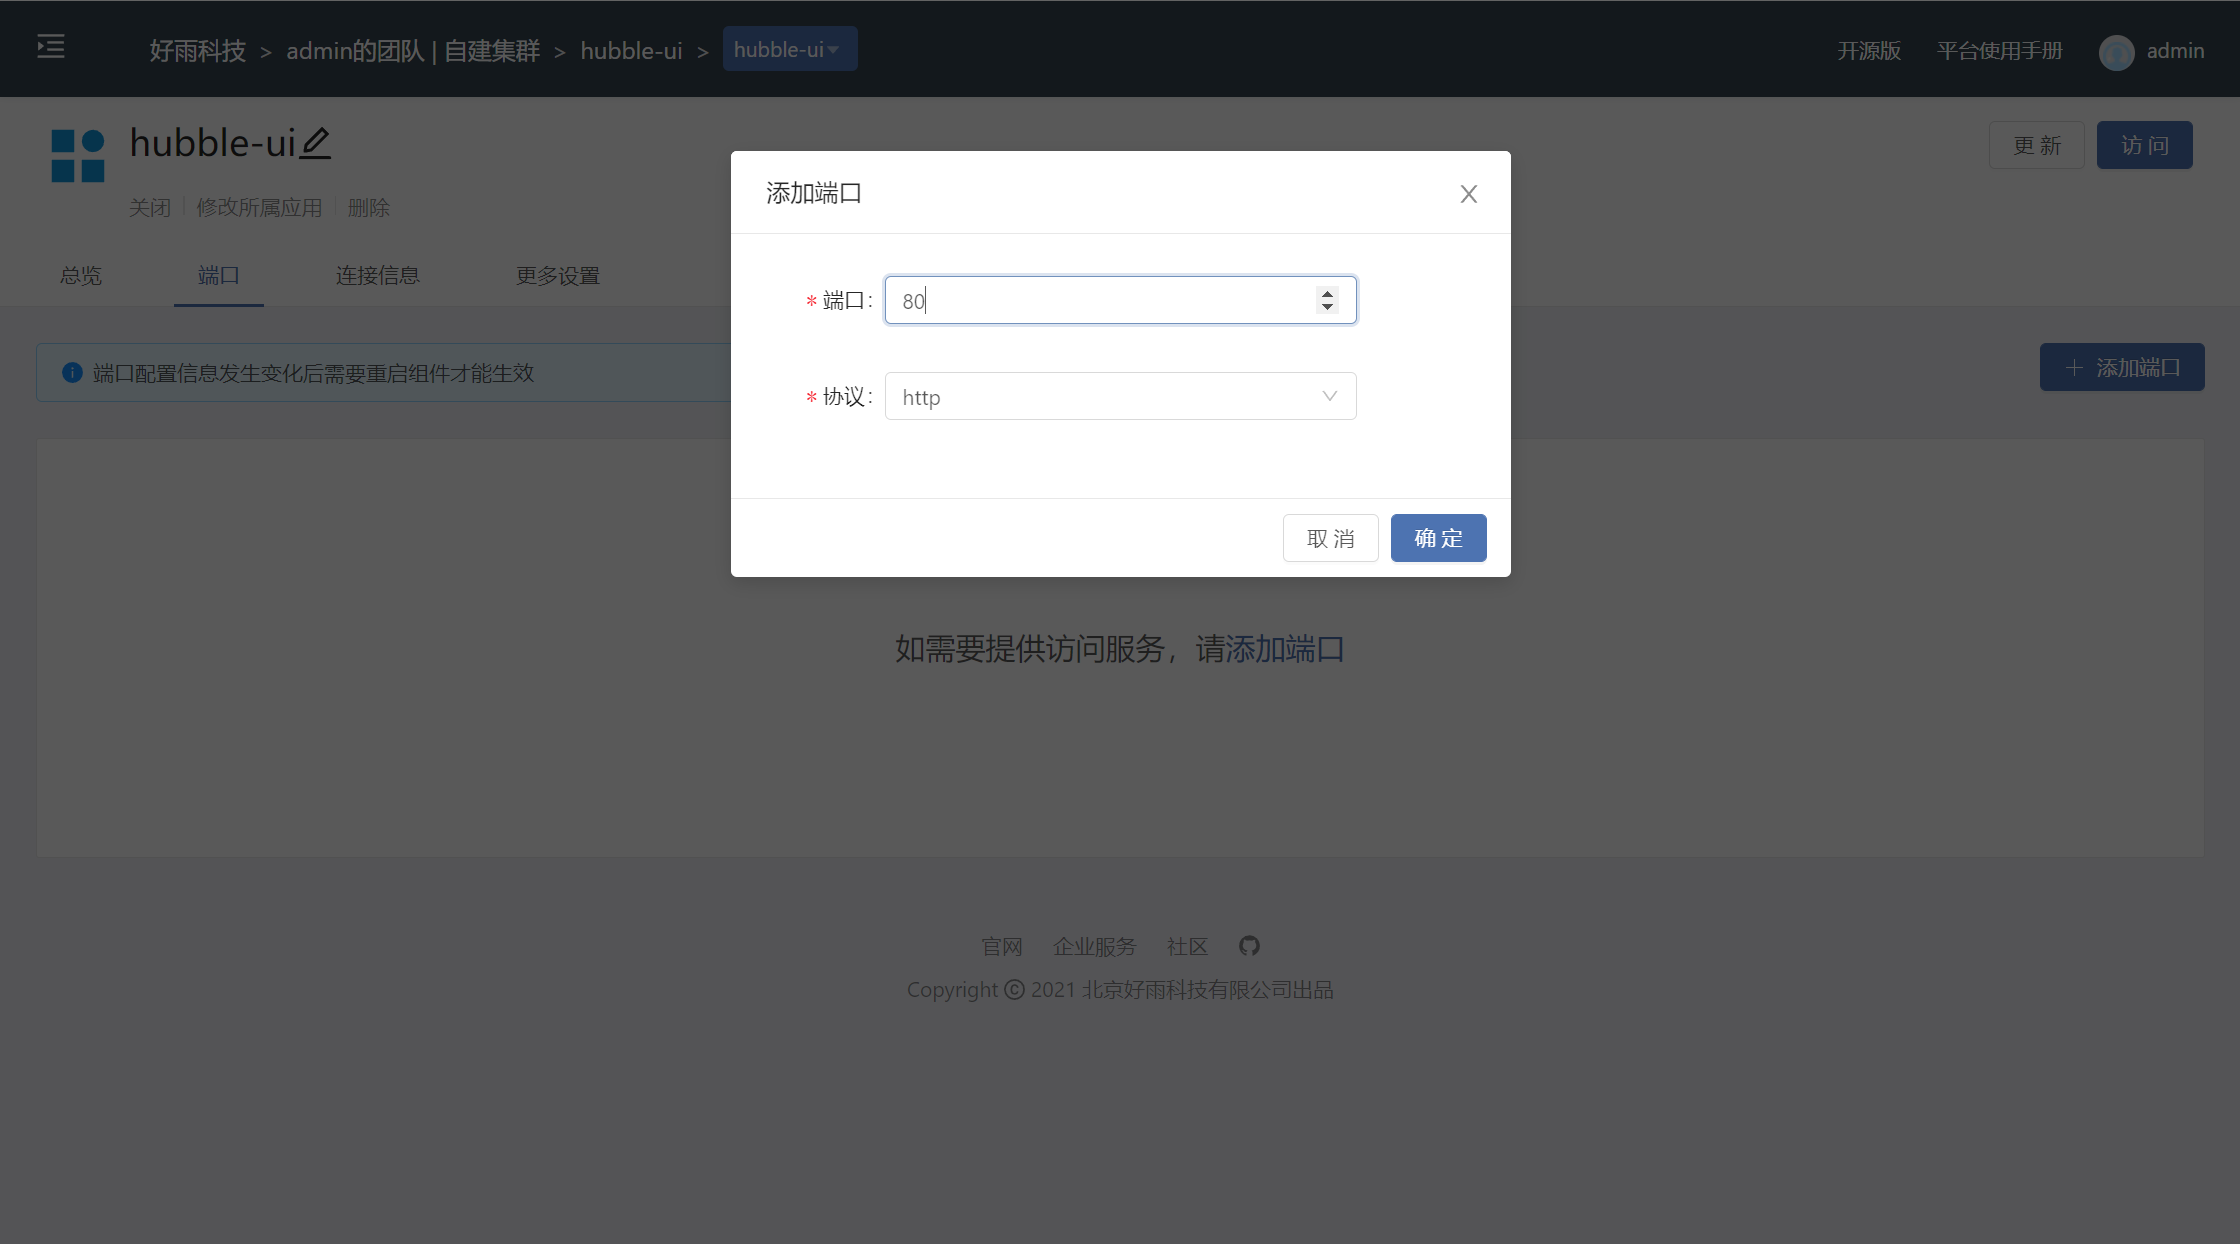
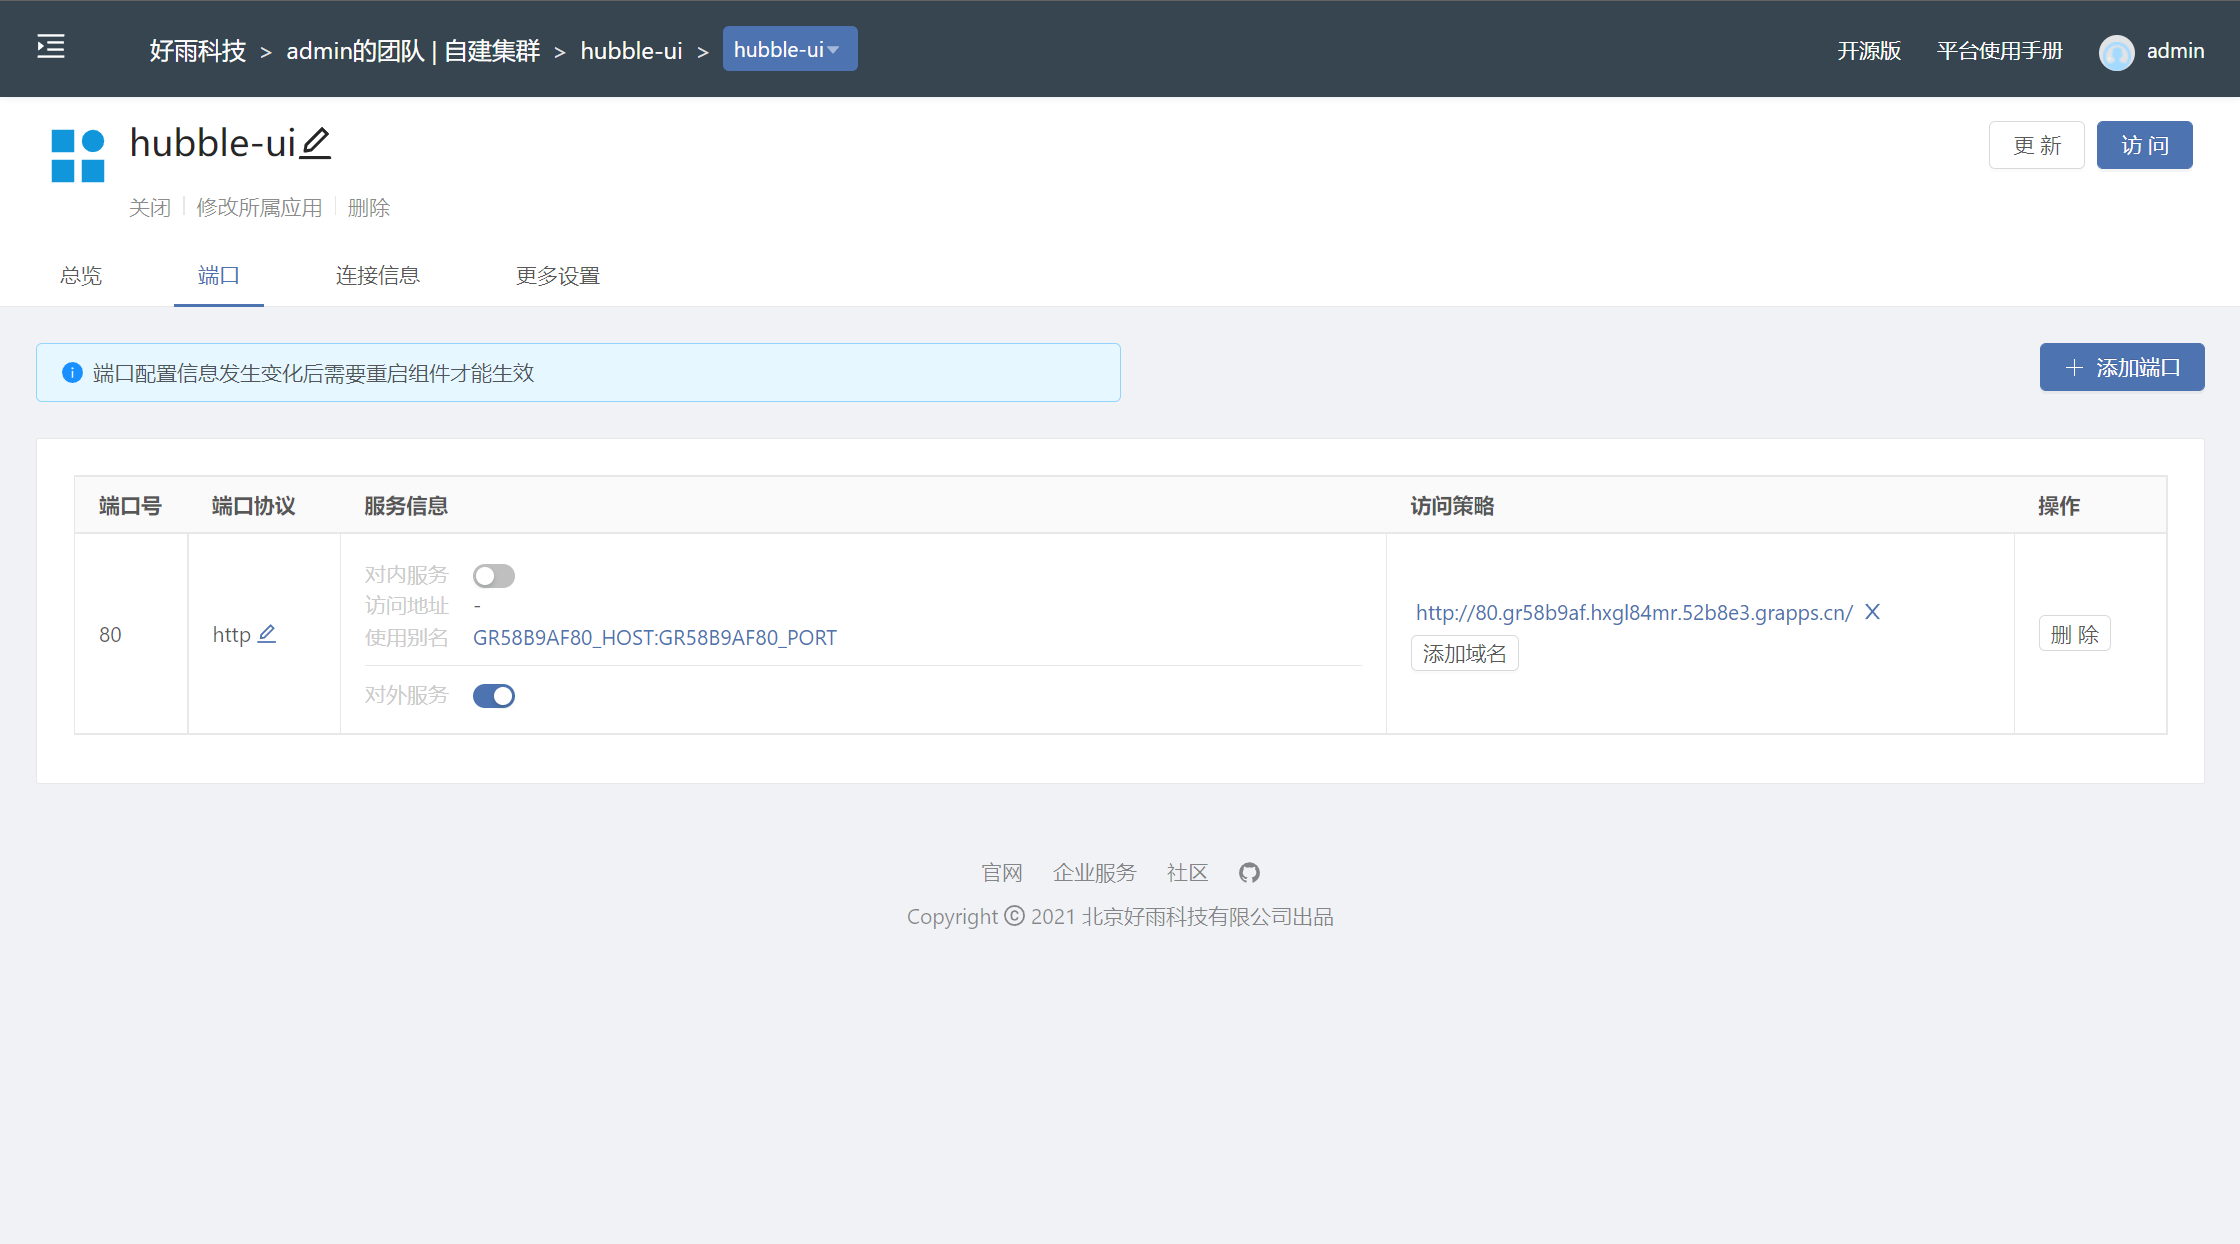
Hubble UI display information
Visit the main page
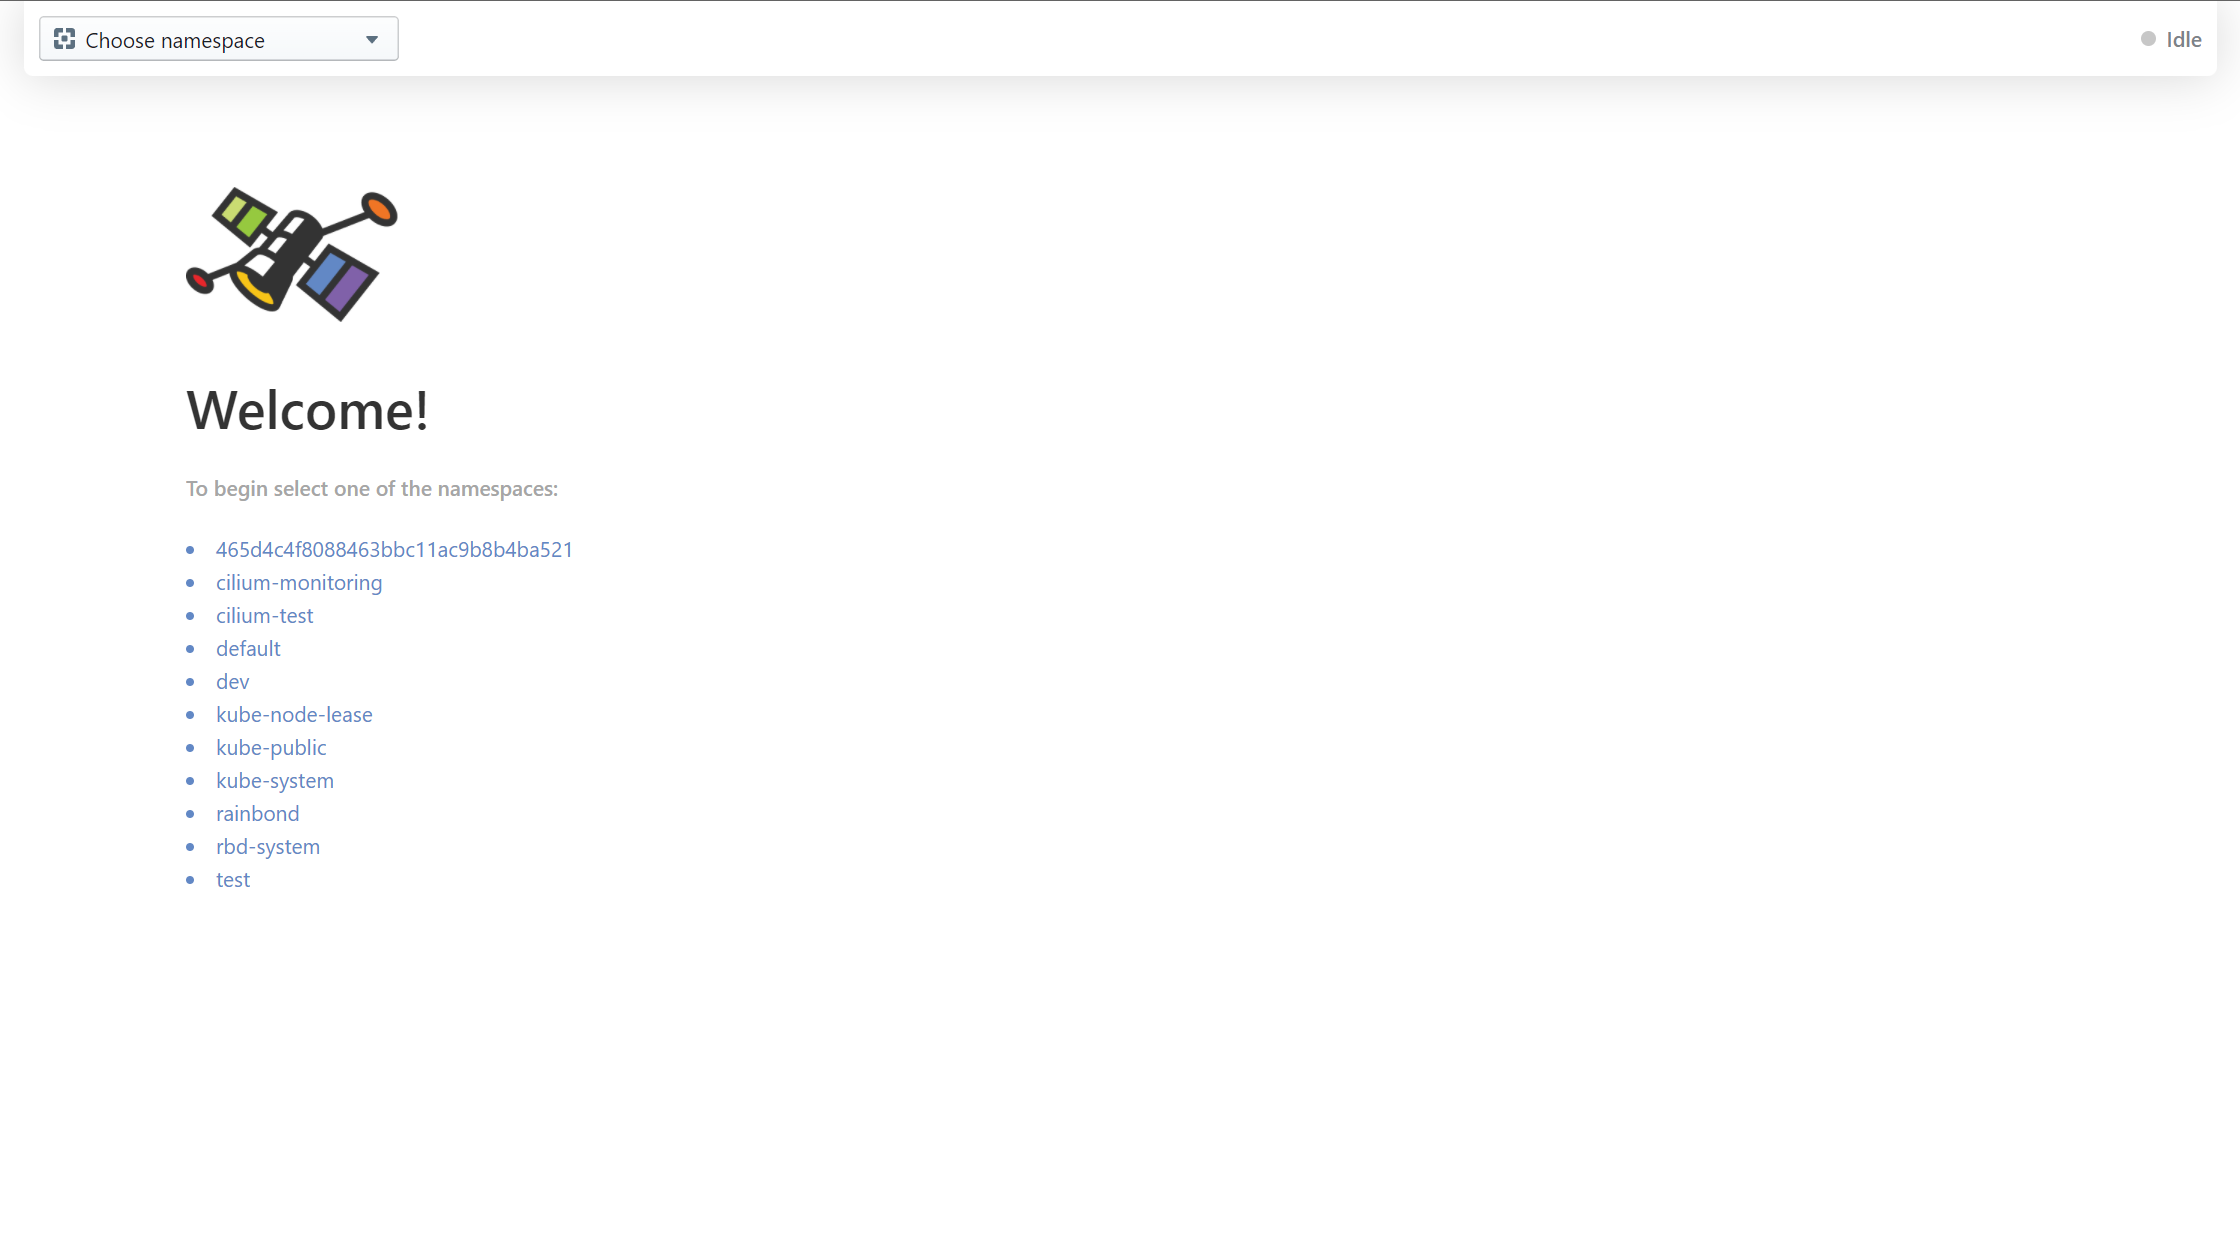
Enter the namespace to be viewed, the current traffic topology is displayed in the middle of the page, and the traffic records are displayed in the lower part.
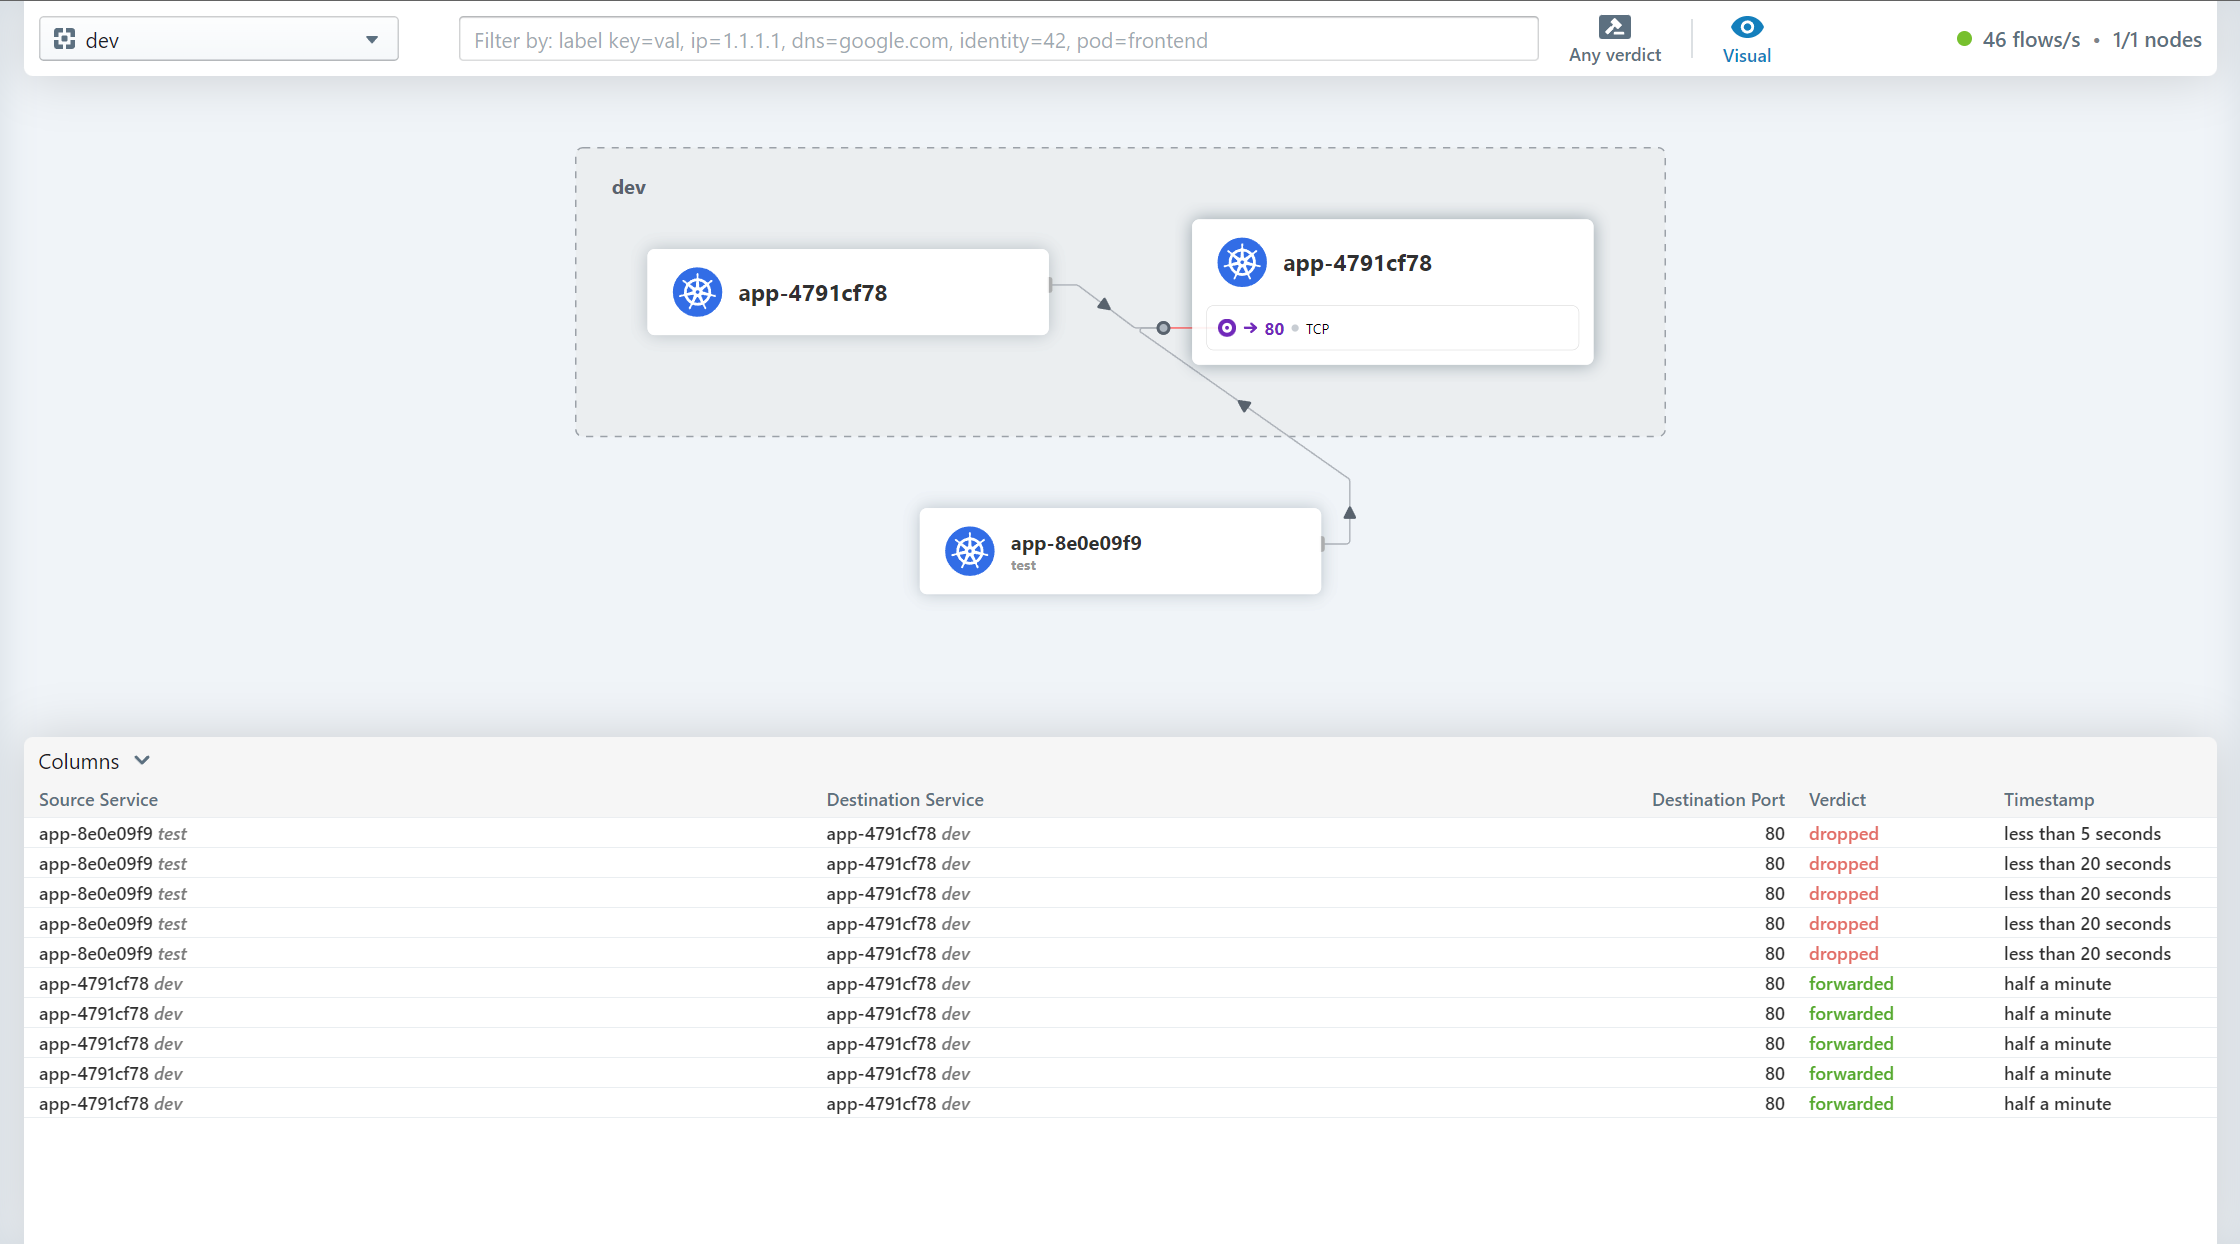
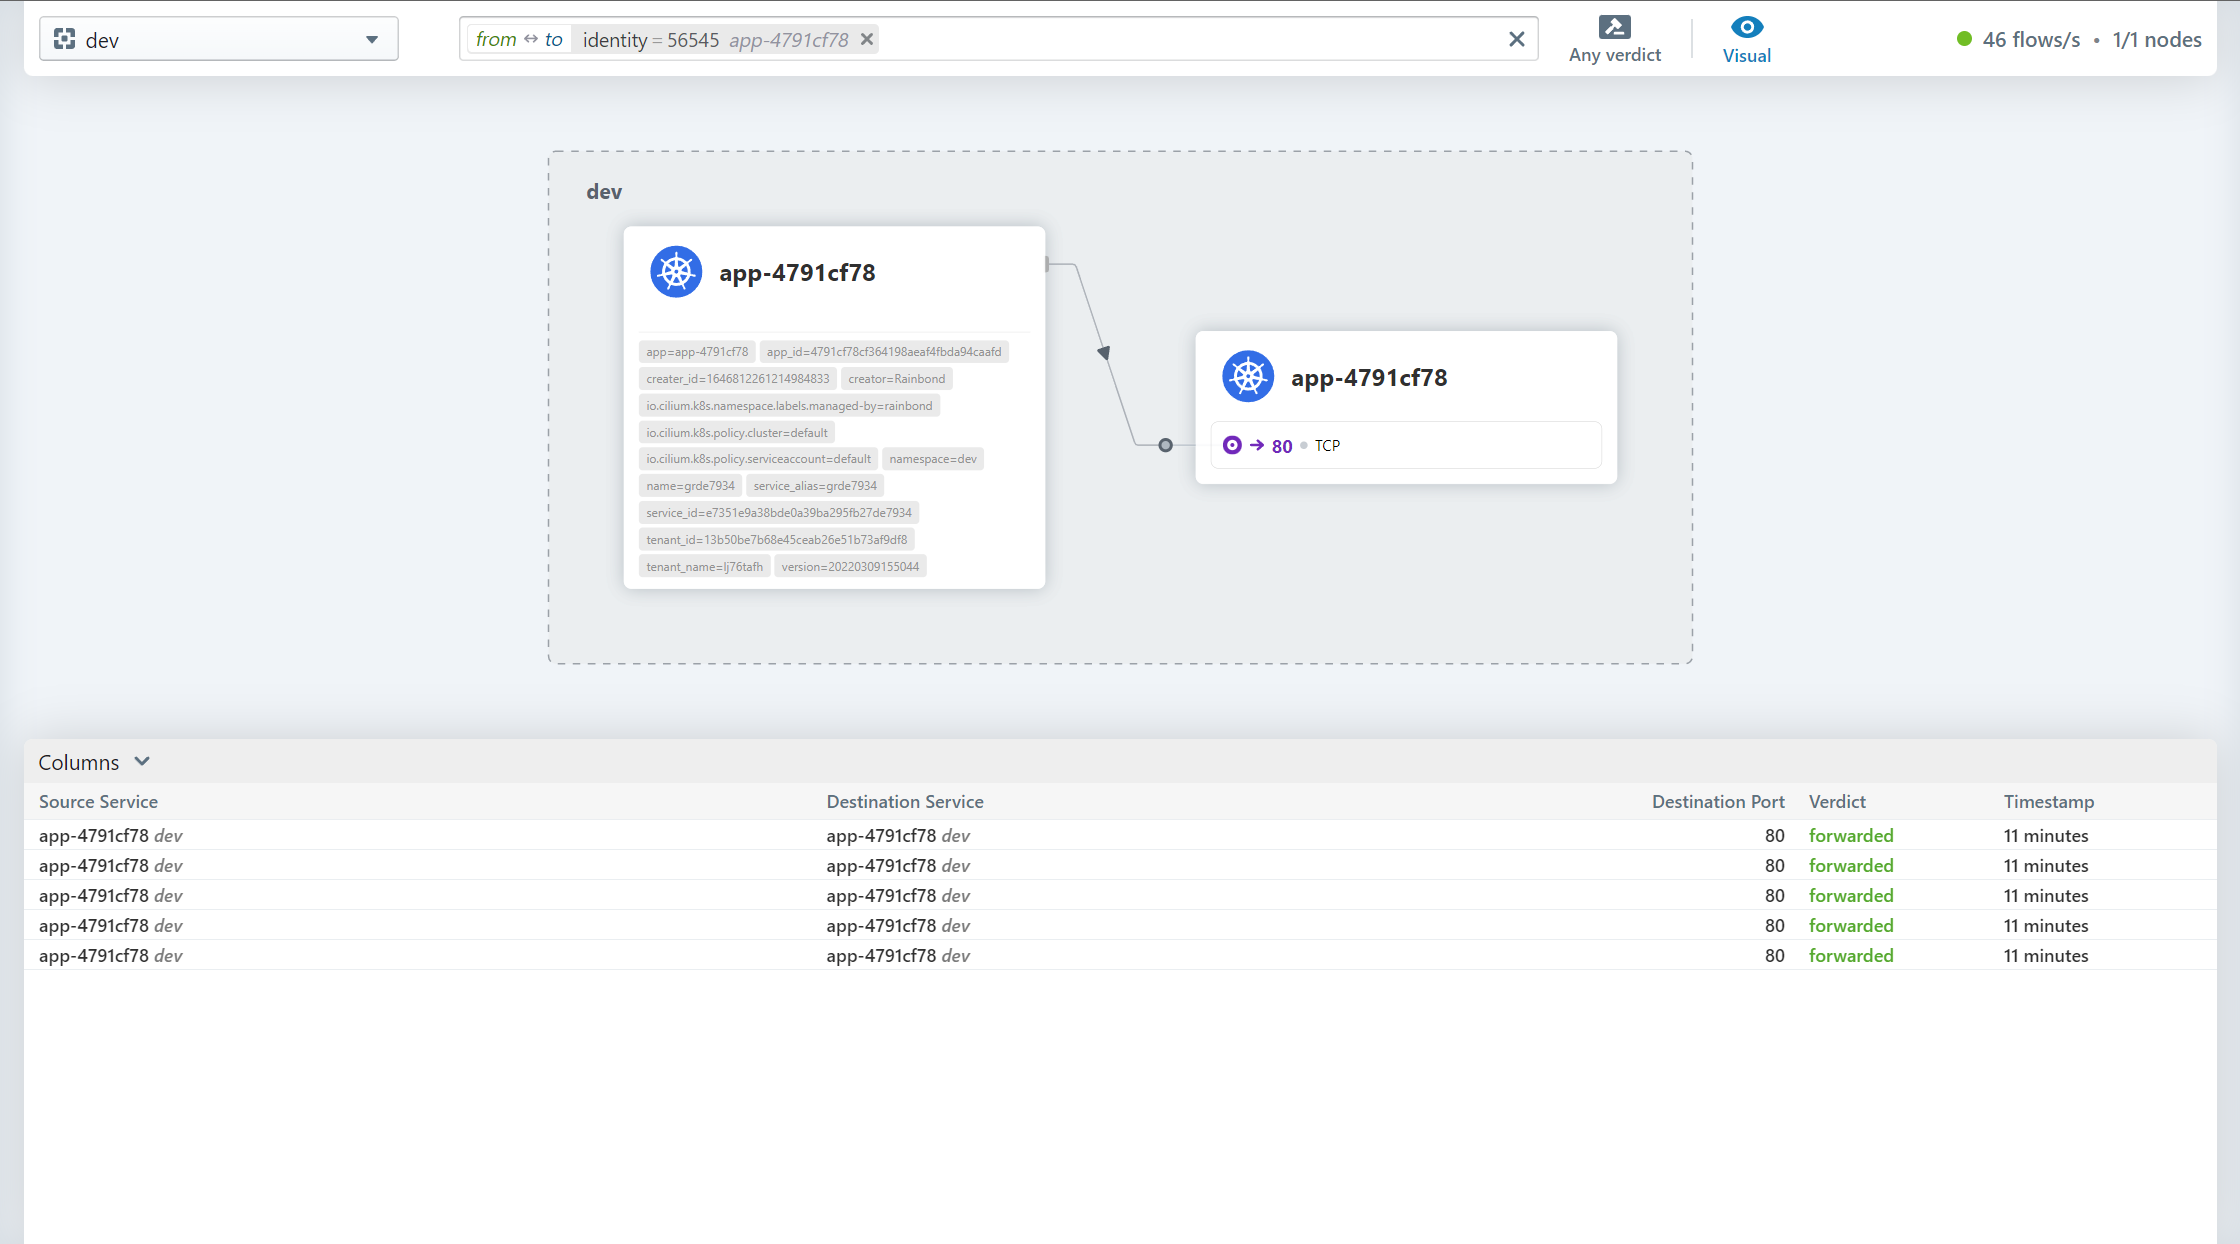
Click on the traffic record to view the details

Only show relevant traffic after clicking the component
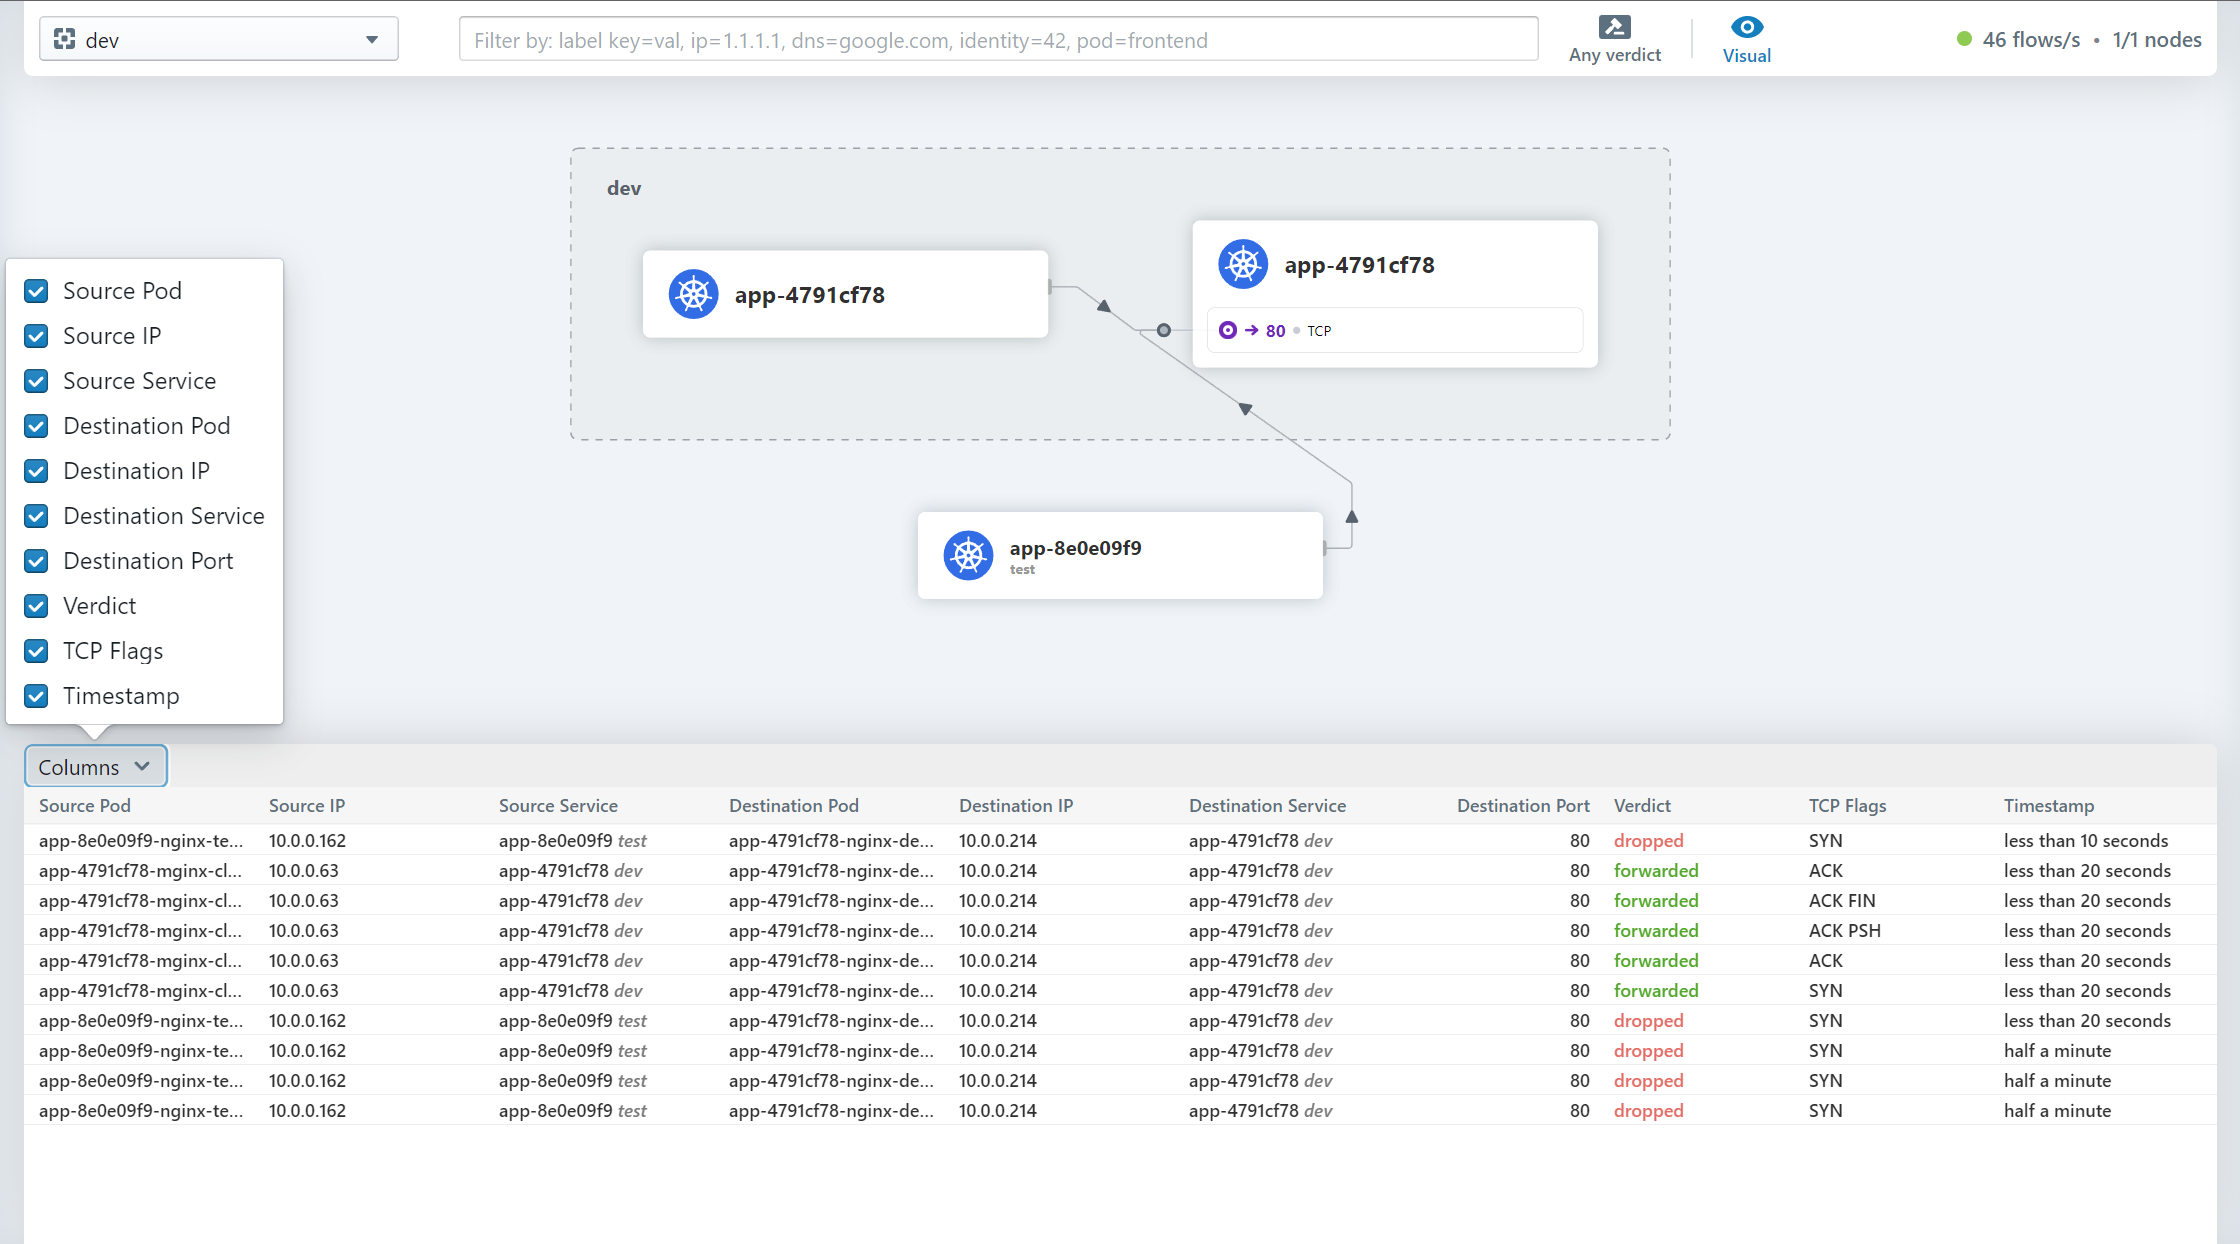
Select the columns of information displayed by the traffic record
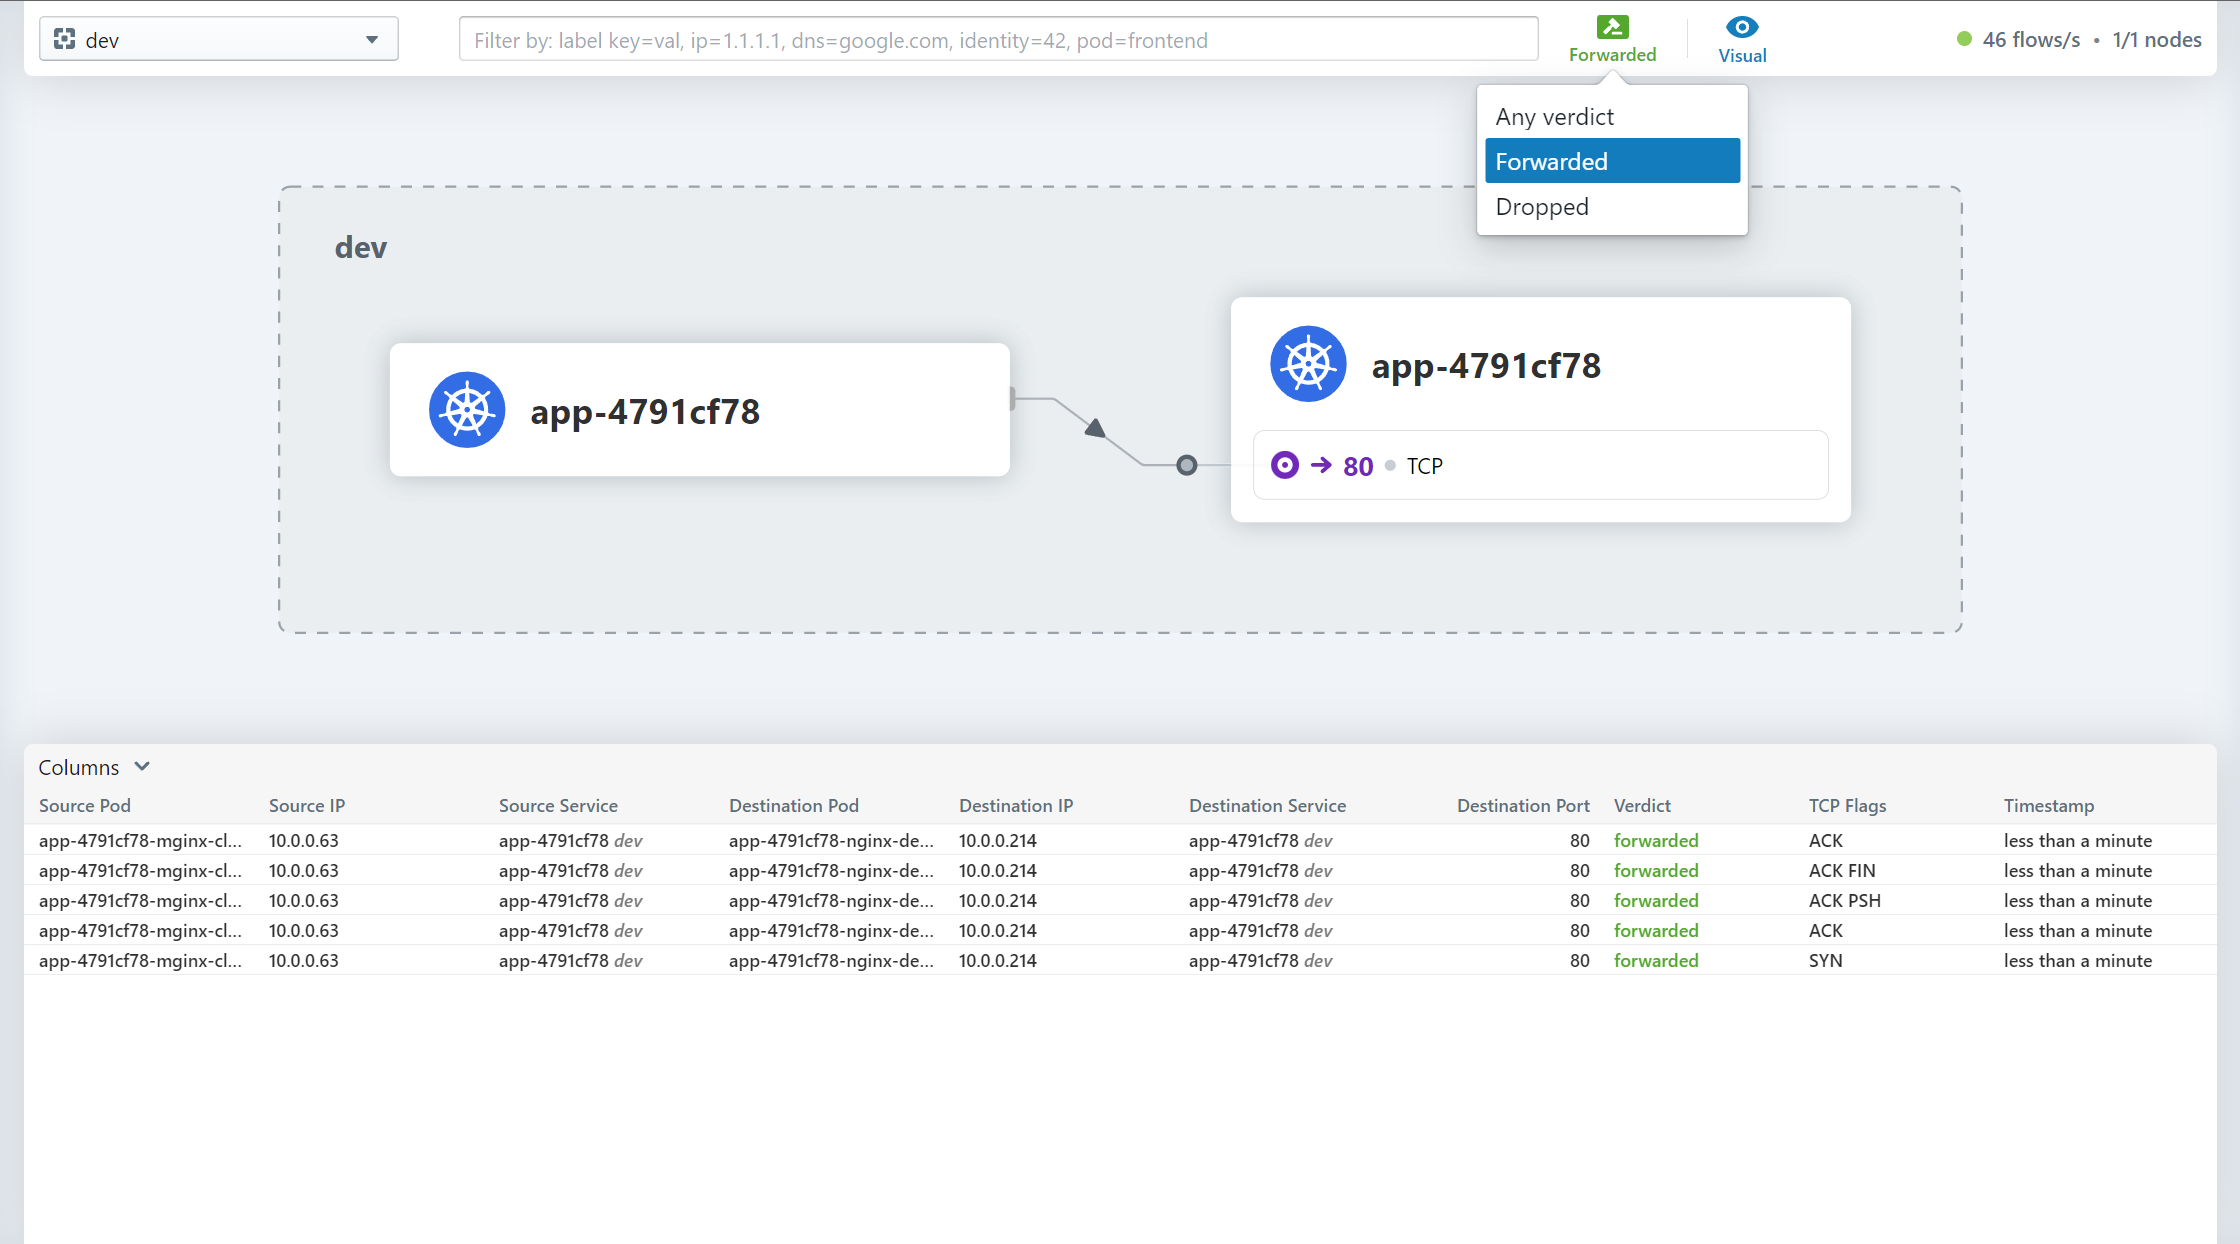
Select the type of traffic to display
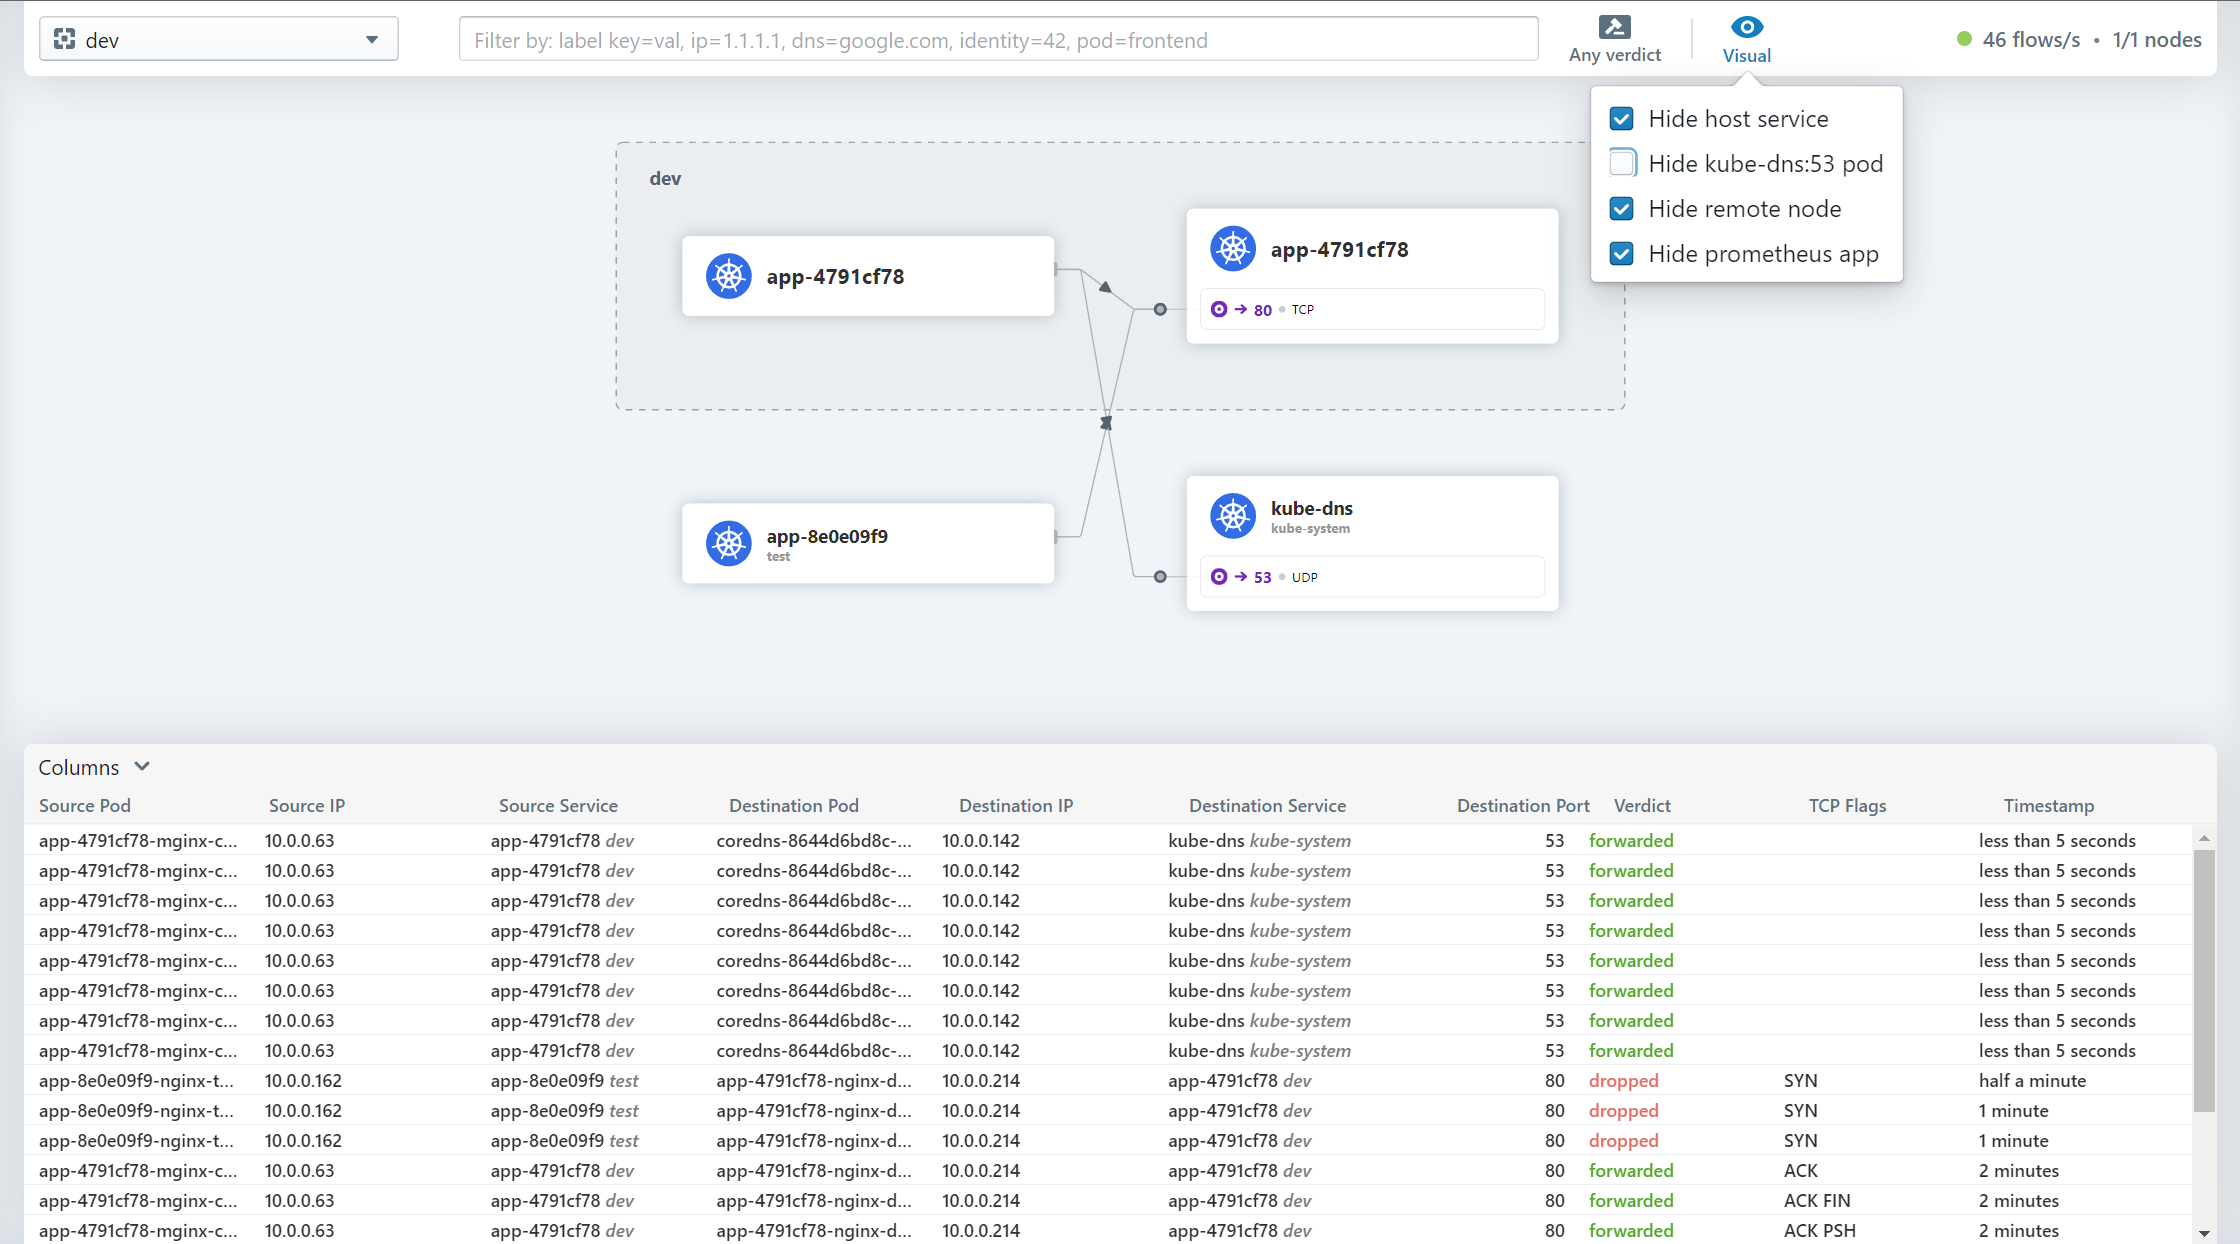
Whether to ignore special types of traffic when choosing impressions
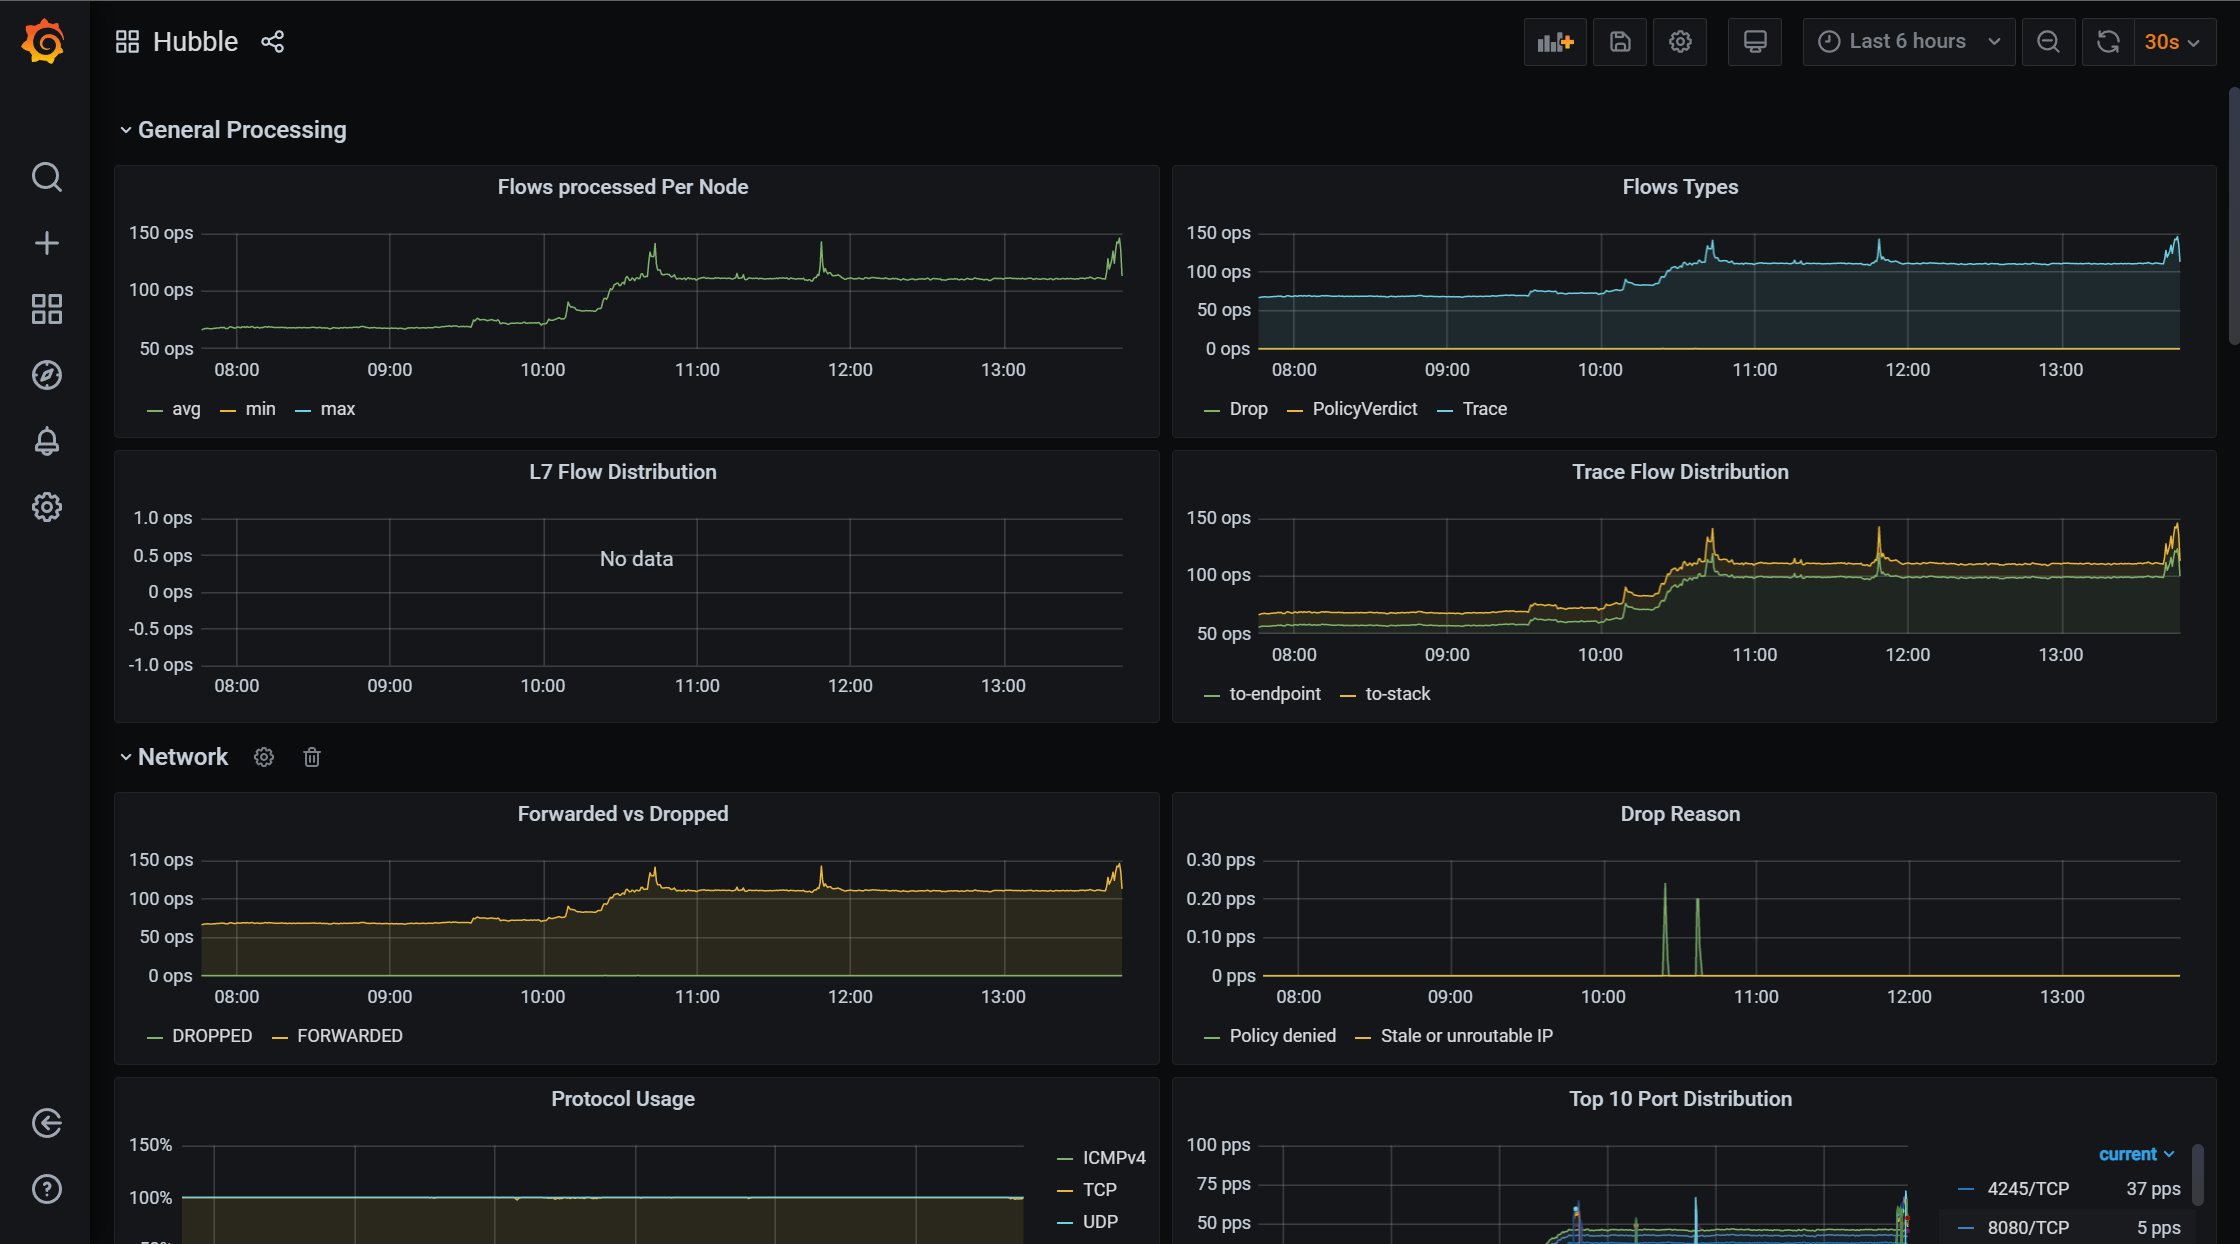
Docking with Prometheus and Grafana
cilium provides the yaml file for deploying Prometheus and Grafana, which contains the template file of Grafana, but cilium does not have open monitoring indicators by default, so you need to enable monitoring indicators before deploying Prometheus and Grafana
Enable monitoring metrics
helm upgrade cilium cilium/cilium --version 1.11.2 \
   --namespace kube-system \
   --reuse-values \
   --set prometheus.enabled=true \
   --set operator.prometheus.enabled=true \
   --set hubble.enabled=true \
   --set hubble.metrics.enabled="{dns,drop,tcp,flow,port-distribution,icmp,http}"
Deploy Prometheus and Grafana
$ kubectl apply -f https://raw.githubusercontent.com/cilium/cilium/1.11.2/examples/kubernetes/addons/prometheus/monitoring-example.yaml
namespace/cilium-monitoring created
serviceaccount/prometheus-k8s created
configmap/grafana-config created
configmap/grafana-cilium-dashboard created
configmap/grafana-cilium-operator-dashboard created
configmap/grafana-hubble-dashboard created
configmap/prometheus created
clusterrole.rbac.authorization.k8s. io/prometheus unchanged
clusterrolebinding.rbac.authorization.k8s.io/prometheus unchanged
service/grafana created
service/prometheus created
deployment.apps/grafana created
deployment.apps/prometheus created
Confirm operating status
$ kubectl get po -n cilium-monitoring
NAME READY STATUS RESTARTS AGE
grafana-d69c97b9b-5ztrj 1/1 Running 0 5d20h
prometheus-655fb888d7-456n4 1/1 Running 0 5d20h
$ kubectl get svc -n cilium-monitoring
NAME TYPE CLUSTER-IP EXTERNAL-IP PORT(S) AGE
grafana ClusterIP 10.43.230.15    <none>        3000/TCP 5d20h
prometheus ClusterIP 10.43.219.180   <none>        9090/TCP 5d20h
Open external access
-
Temporarily open
kubectl -n cilium-monitoring port-forward service/grafana --address 0.0.0.0 --address :: 3000:3000
kubectl -n cilium-monitoring port-forward service/prometheus --address 0.0.0.0 --address :: 9090:9090 -
long-term open
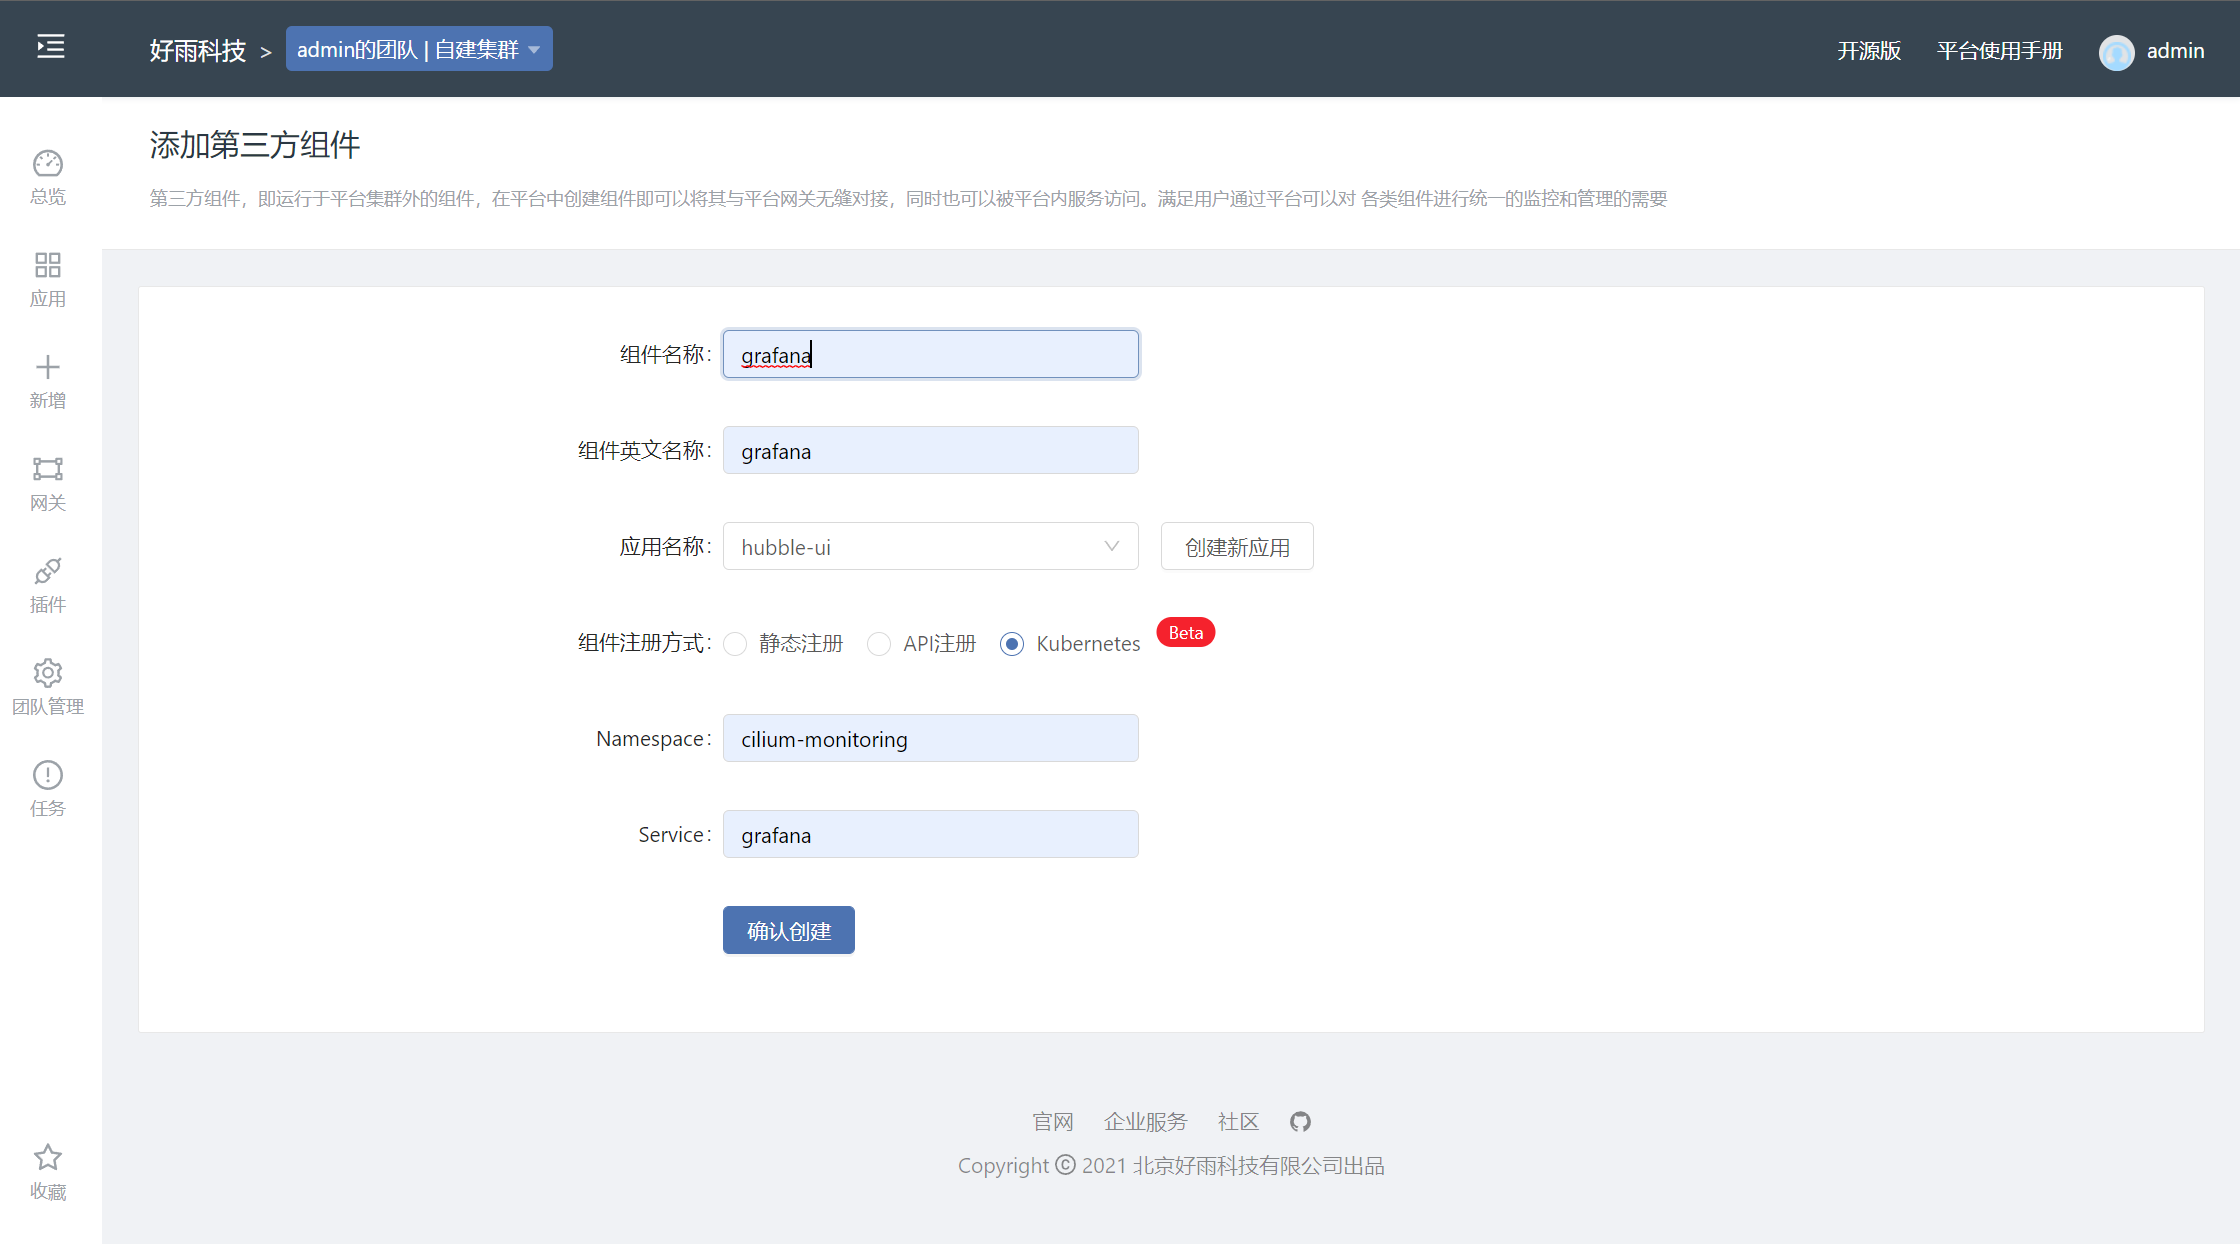
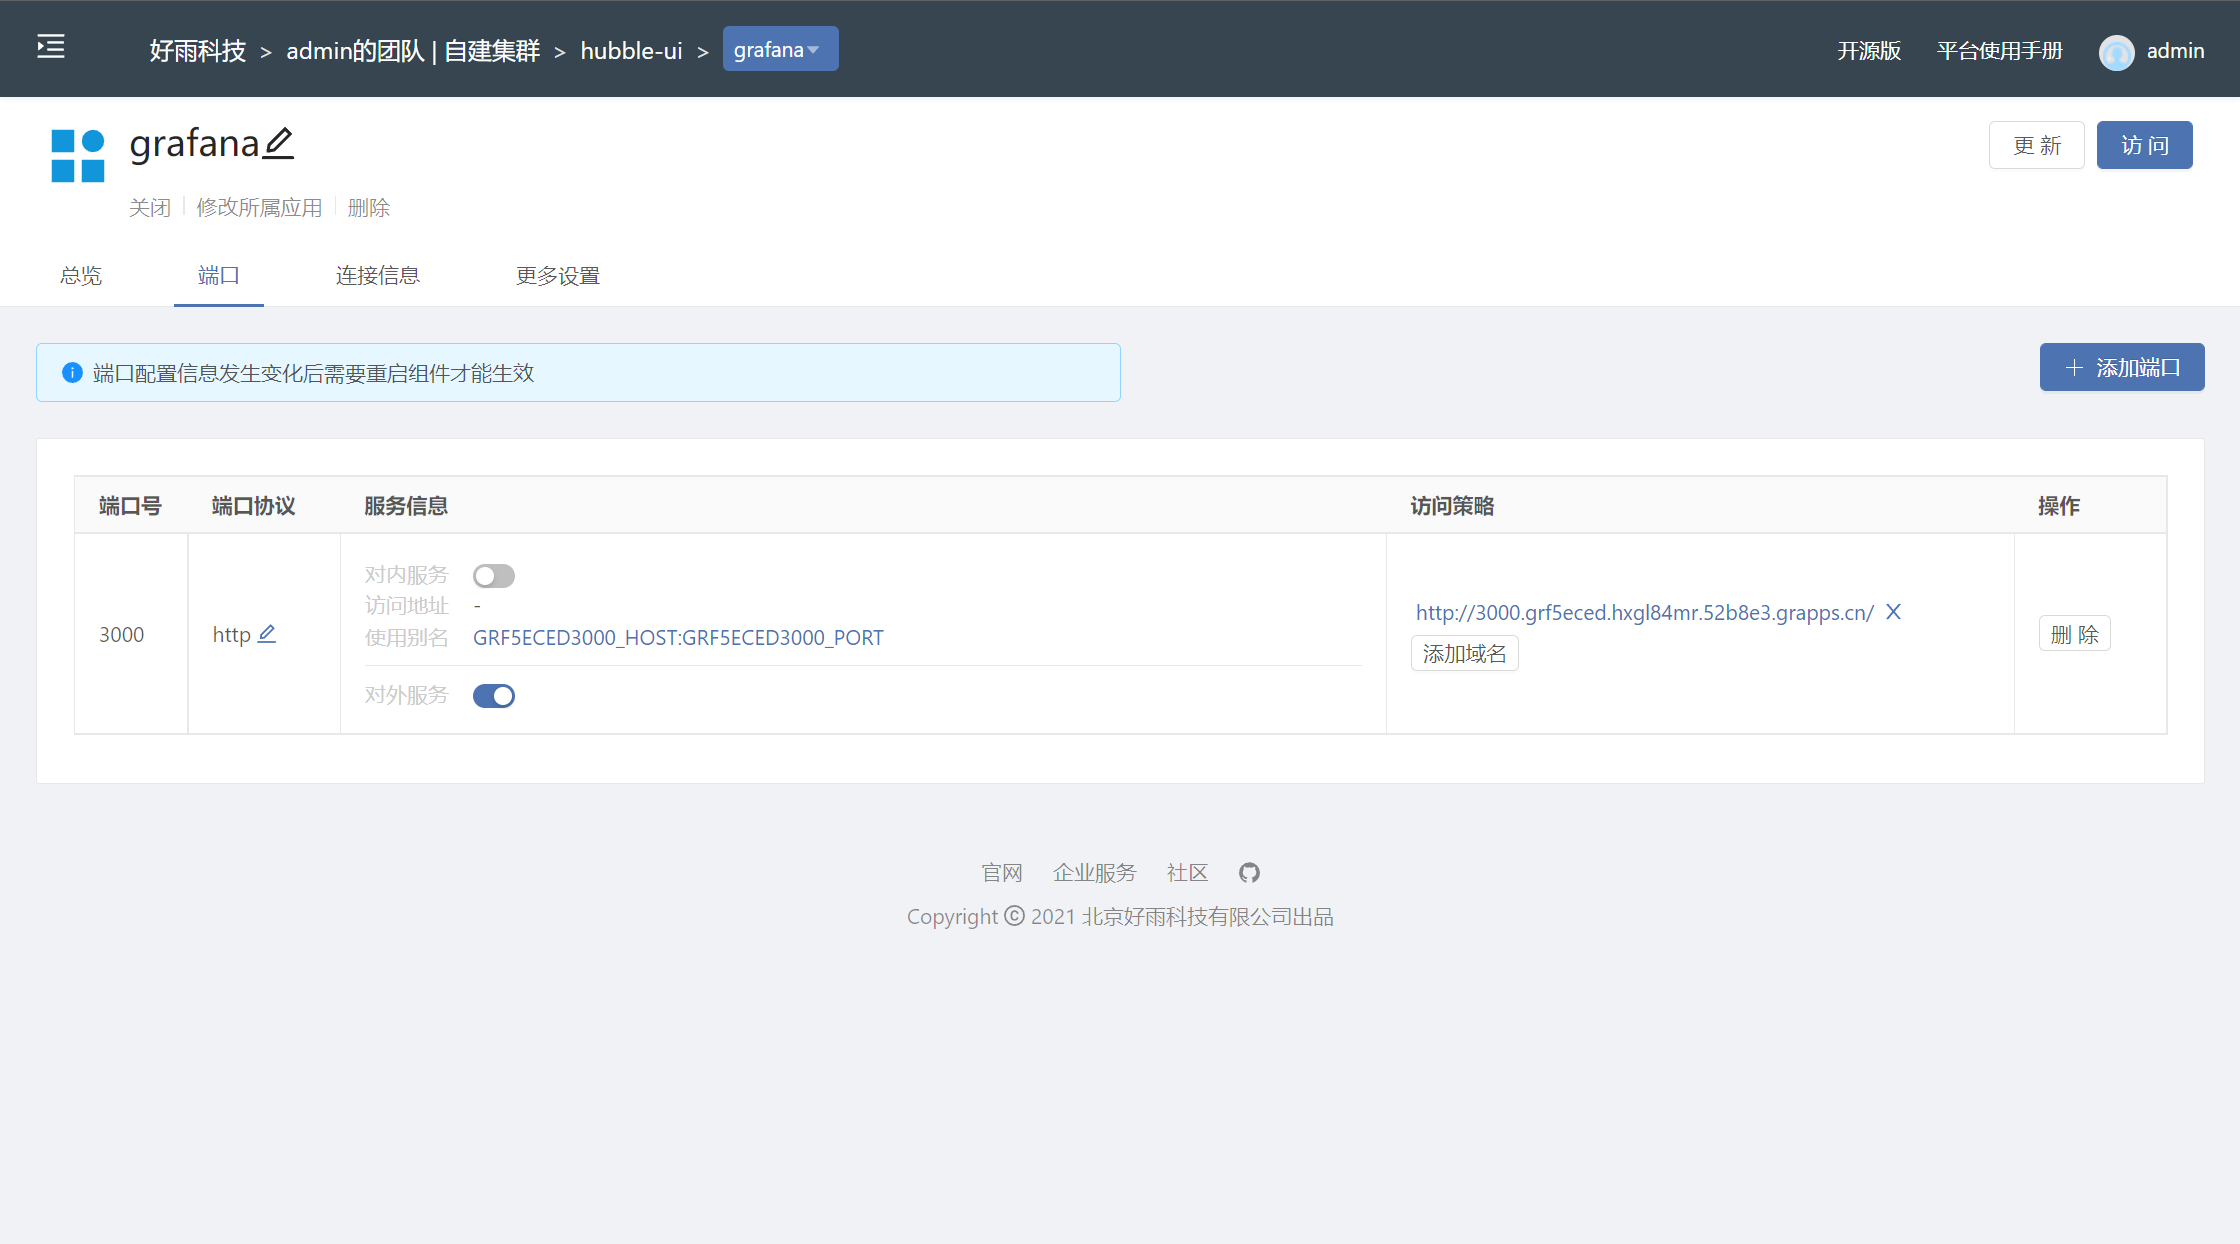
Grafana display information
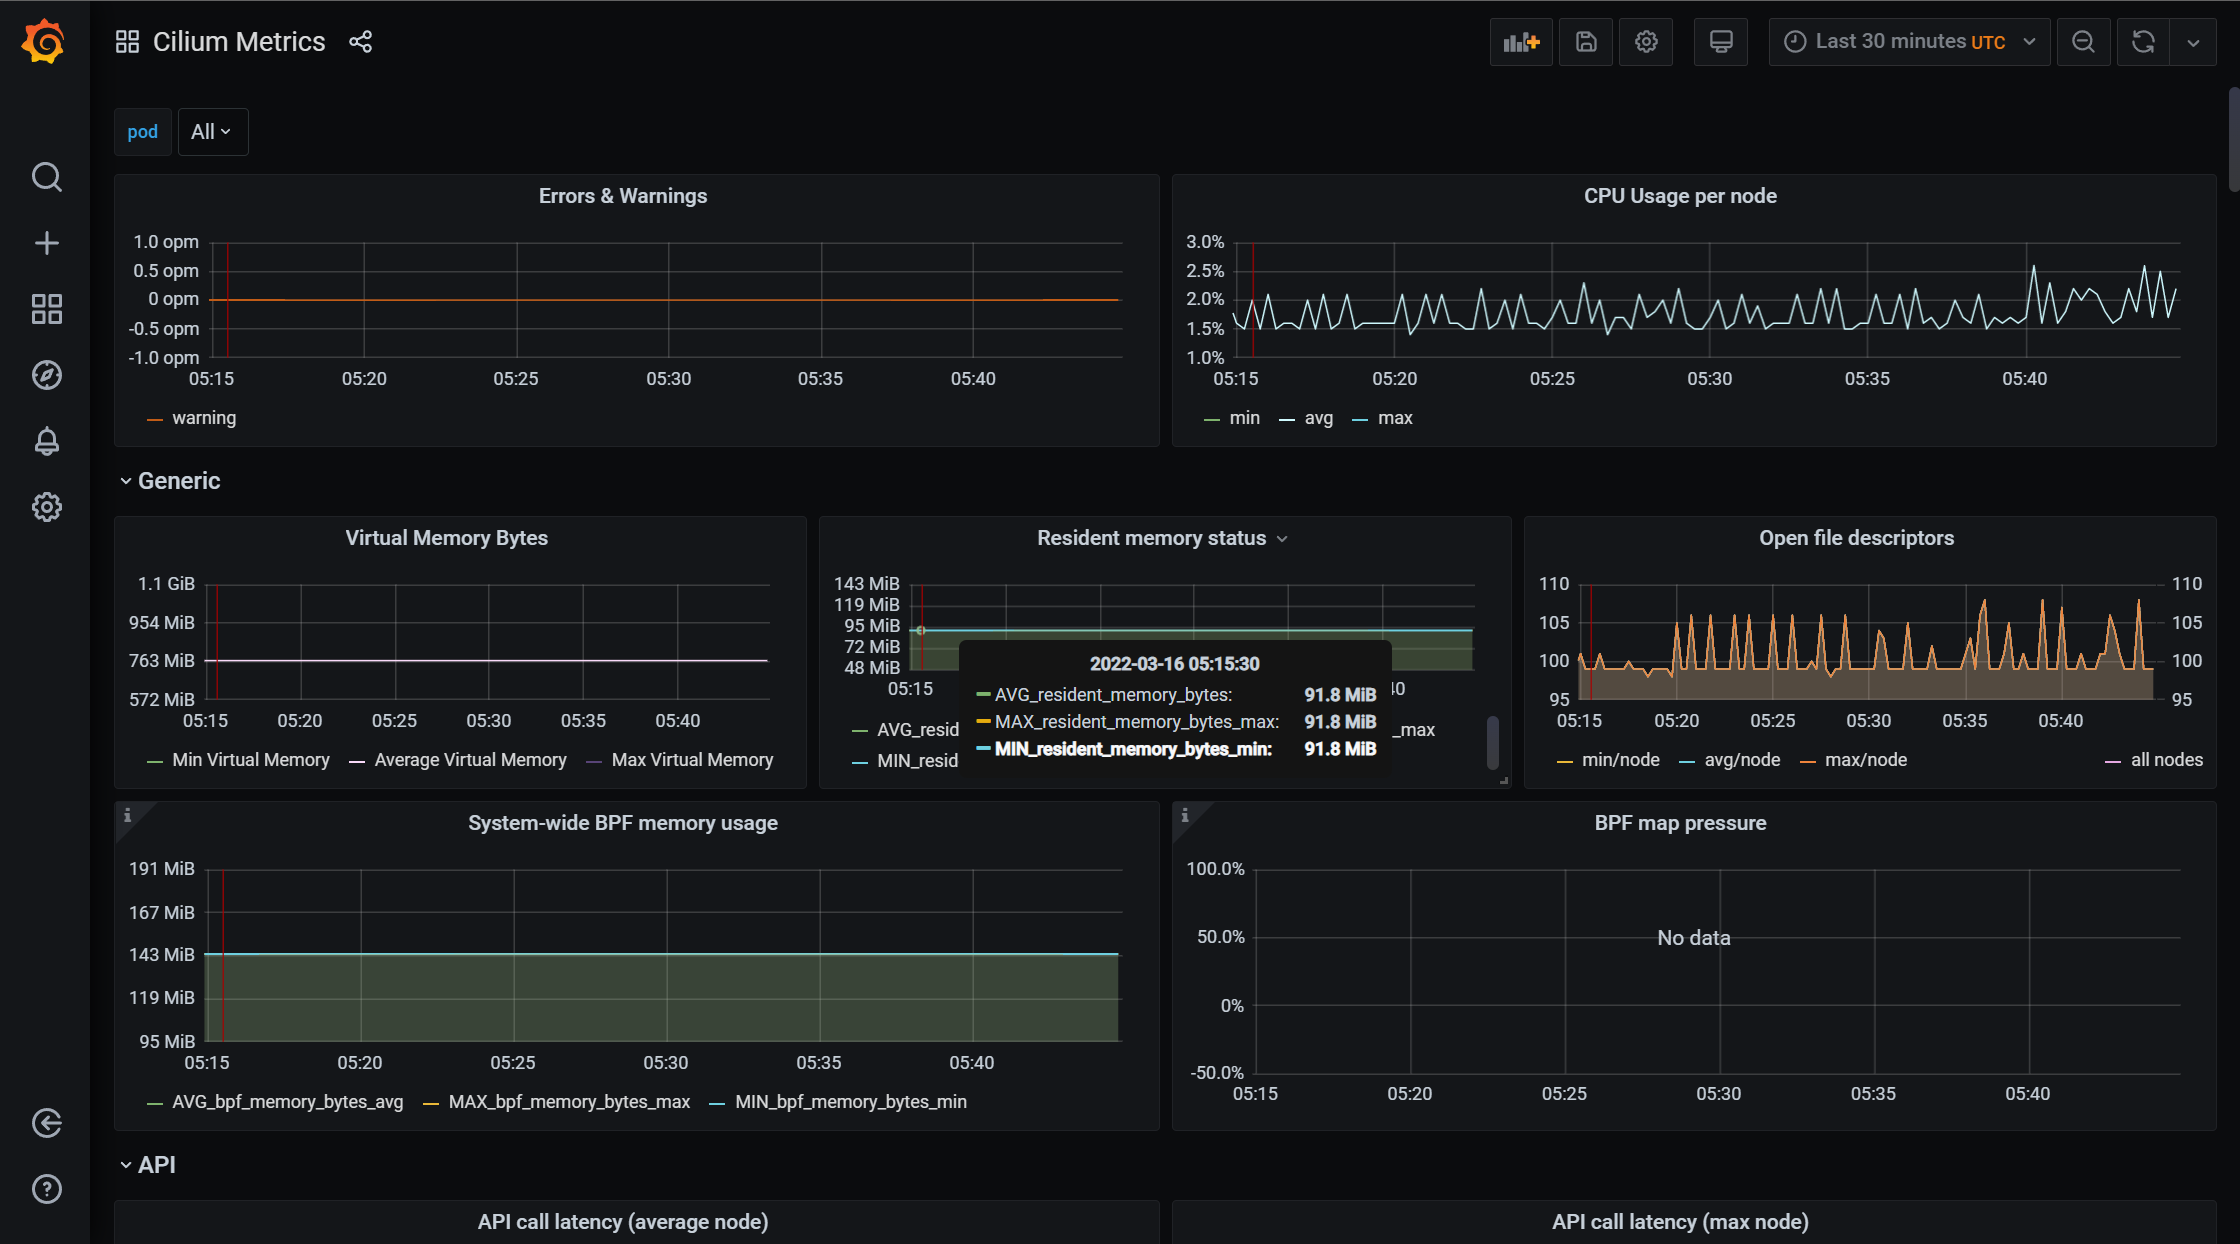
Cilium Metrics
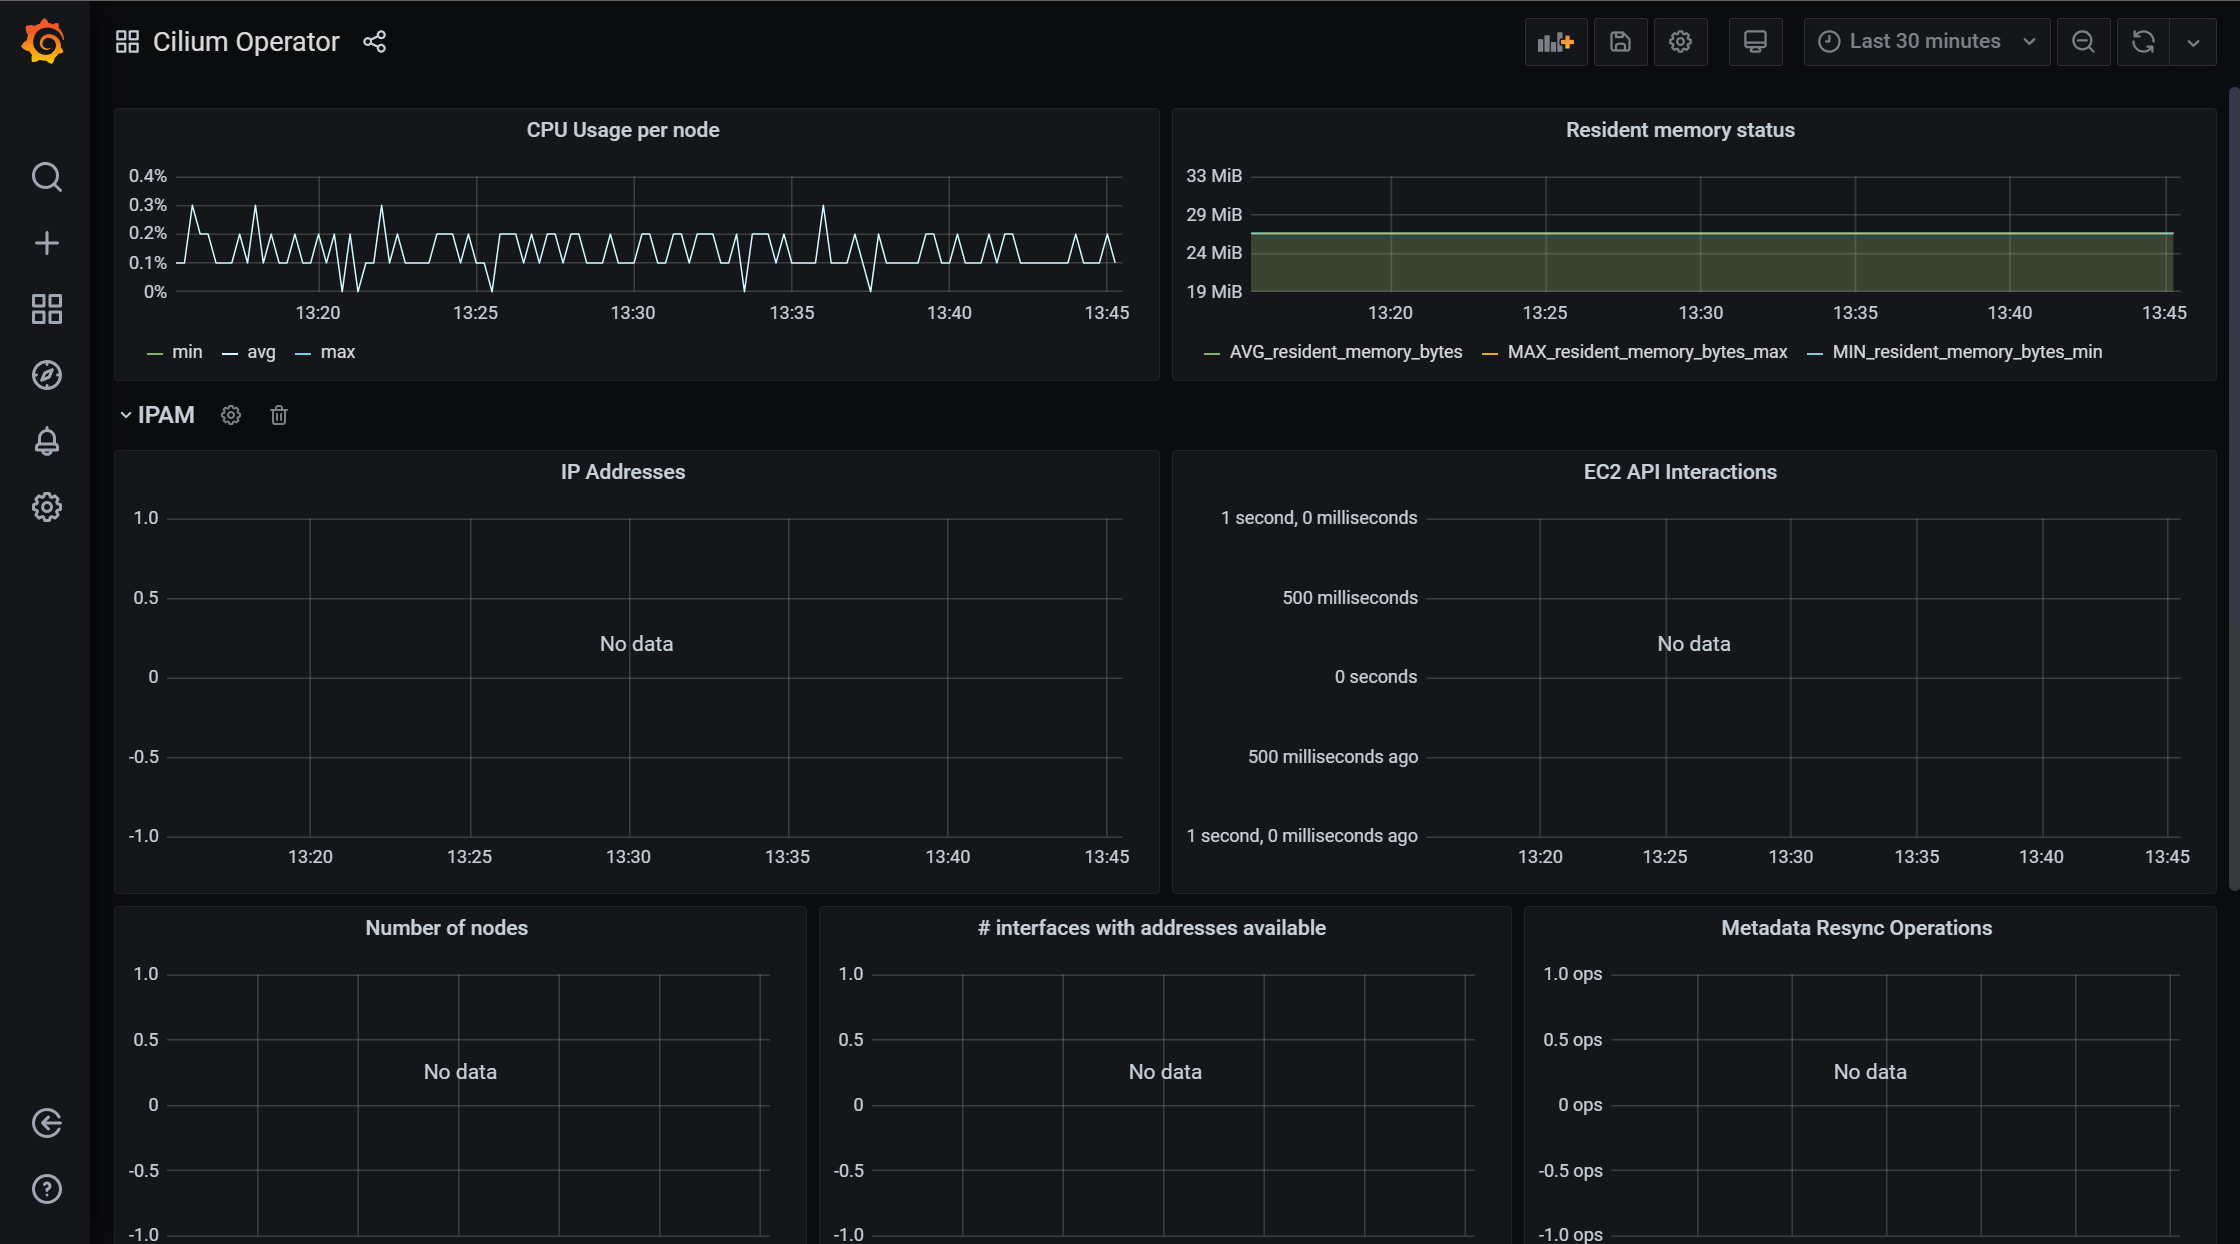
Cilium Operator
Hubble
