Component auto scaling
The load of the component will keep changing, from high and low, it is difficult to configure appropriate resources for it; Rainbond introduces automatic scaling, which can solve this problem well. Component automatic scaling will always observe the indicators set by the user, once the indicator Above or below the desired threshold, components are automatically scaled.
This article will introduce the automatic scaling function of components according to the following three aspects:
- The principle of automatic scaling of components.
- How to use component auto scaling.
- A demo example of auto scaling of components.
The principle of automatic scaling of components
There are two types of automatic scaling of components, namely horizontal automatic scaling and vertical automatic scalingHorizontal scaling increases or decreases the number of copies of a component; while automatic horizontal scaling is based on the component's CPU usage, memory or other Custom metrics, which automatically perform horizontal scaling of components. Vertical scaling, which allocates more or less CPU and memory to components; and automatic vertical scaling, which is based on components' CPU usage, memory or other custom metrics, Automatically perform vertical scaling of components. Currently (5.1.9), Rainbond only supports horizontal automatic scaling of components, so this article will not cover too much Vertical automatic scaling.
Automatic scaling of components horizontally
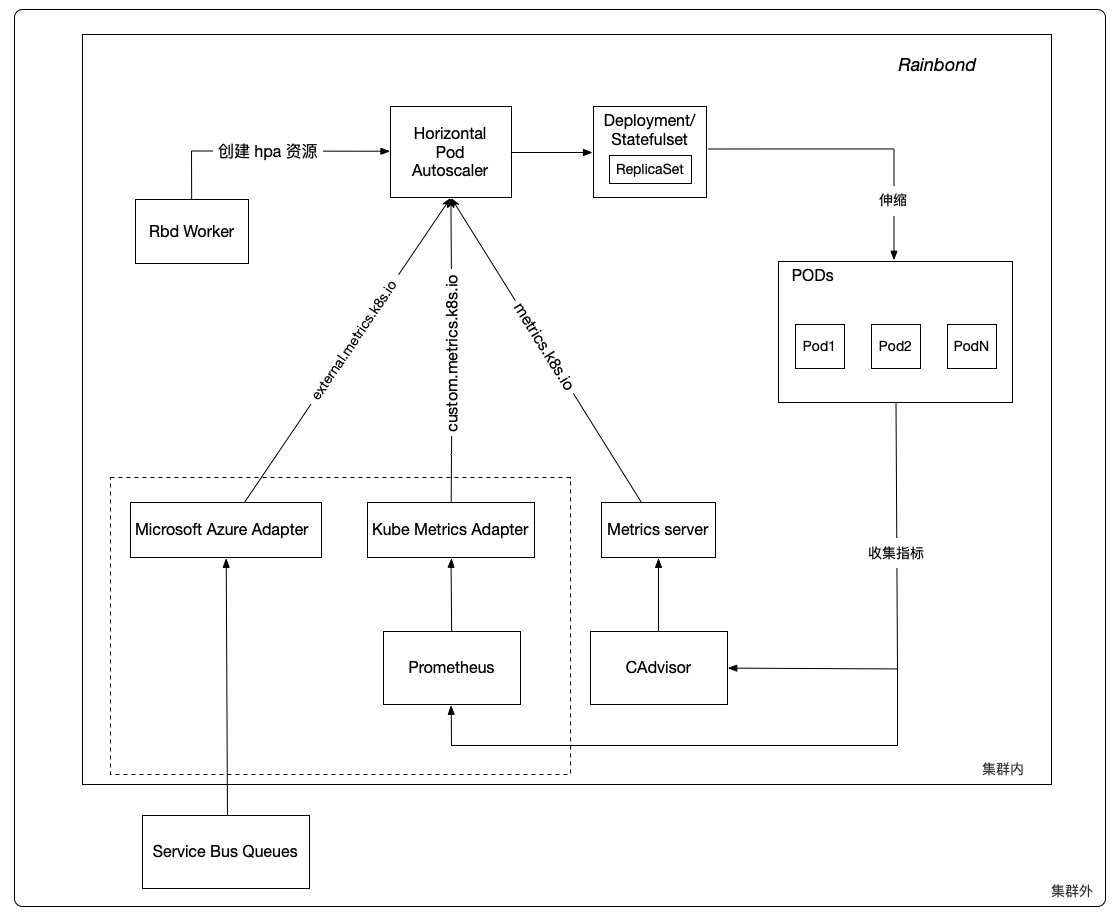
Horizontal Pod Autoscaler consists of two parts, HPA Resource and HPA Controller HPA Resource defines the behavior of the component, including metrics, expected values, and maximum and minimum replica counts, etc. HPA Controller, Period Check the metrics set by the inspection component; its period is controlled by the parameter --horizontal-pod-autoscaler-sync-period of controller manager , the default is 15 seconds.
Rbd Worker is responsible for converting the metrics, expected values, and the maximum and minimum number of replicas you set for the component in the cloud console into HPA resourcesin the kubernetes cluster. It is used by the HPA controller.
In each cycle, the HPA controller queries the metrics set by the user for each component through mertrics API ; when the metrics exceed or fall below the desired threshold, the HPA controller adjusts the number of replicasin the Deployment/Statefulset, and finally Deployment/Statefulset completes the increase or decrease of the number of component instances.
The HPA controller generally observes metrics from three aggregation APIs metrics.k8s.io, custom.metrics.k8s.io and external.metrics.k8s.io.
metrics.k8s.io This API is provided by metrics-server , corresponding toresource metrics (resource metrics), namely CPU usage, CPU usage and Memory usage, Memory UsageAlso the type of indicator currently supported by Rainbond.
custom.metrics.k8s.io corresponds to custom metrics, external.metrics.k8s.io corresponds to external metricsFor example: requests-per-secon, Packets-per-second received (packets-per-second) by Kube Metrics Adapter, Prometheus Adapter
Or it is provided by a third-party service implemented by itself that follows the definition of metrics API Custom metrics and external metrics are generally the same.
Custom metrics do not support usage, it can only bevalue, or usage, which is the average value of each instance of the component.
Currently in 5.1.9, Rainbond only supports resource indicators, which are indicators related to CPU and memory. The custom indicators and external indicators in the dotted box will be implemented in future versions.
Algorithm for Horizontal Auto Scaling
At the most basic level, the Horizontal Pod Autoscaler calculates the desired number of instances based on the ratio of the metric's target value to the metric's actual value:
desiredReplicas = ceil[currentReplicas * ( currentMetricValue / desiredMetricValue )]
For example, if the actual value of the indicator is 200m, and the expected value is 100m, then the number of instances will be doubled, because 200.0 / 100.0 == 2.0; if the actual value is reduced to 50m, then the number of instances will remain unchanged, because 50.0 / 100.0 == 0.5(ratio close to 1.0, the HPA controller will skip scaling).
Use of component auto scaling
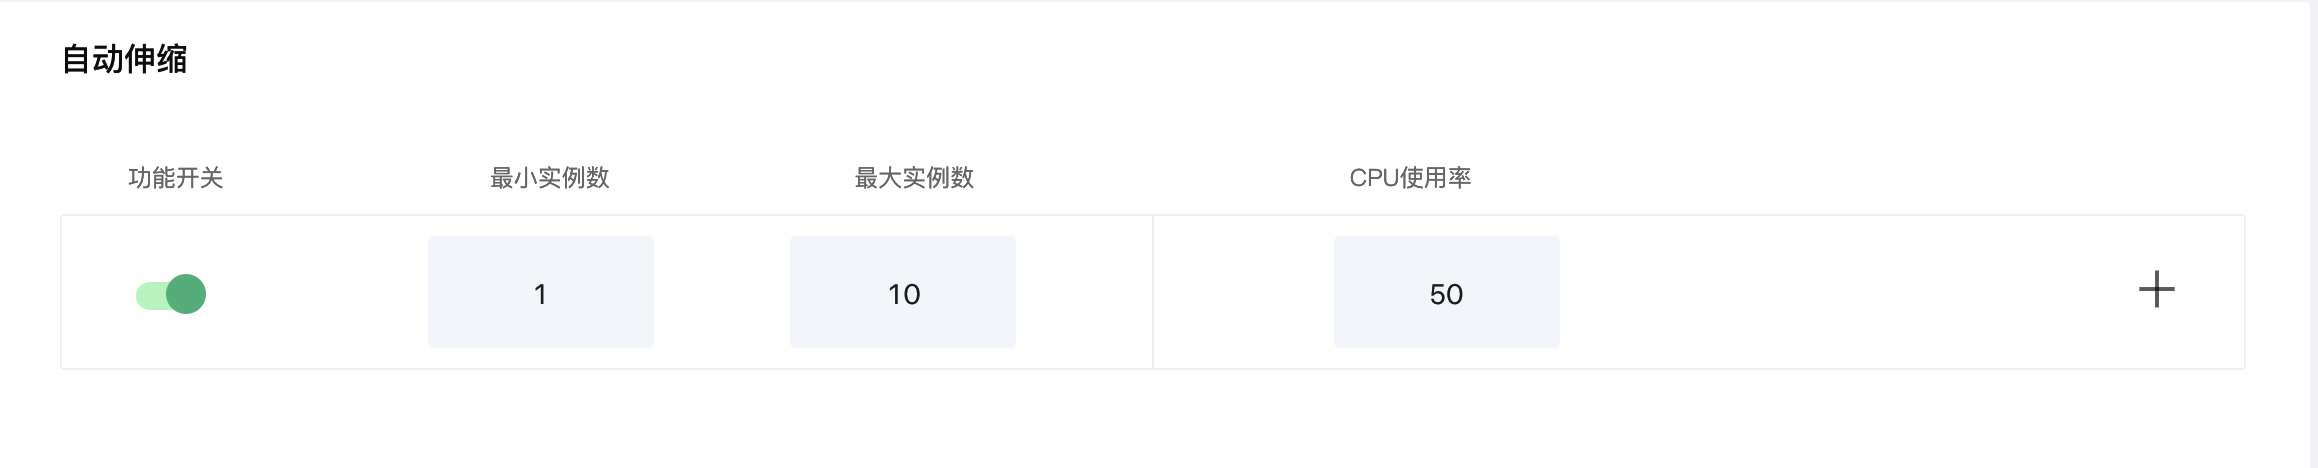
The automatic scaling of components is located in thescalingoption on the component page, undermanual scaling.
As mentioned in component horizontal auto-scaling , you can set auto-scalingmaximum number of replicas, minimum number of replicas and metricson the auto-scaling page.
Maximum number of instances
When the actual value of the indicator exceeds its expected value, the number of instances of the component will continue to increase, and try to make the actual value of the indicator lower than the expected value. When the number of instances is equal toand the maximum number of instances is, the actual value of the indicator is still higher than the expected value. , then the number of instances is fixed at, the maximum number of instances is, and will not continue to grow.
Minimum number of instances
When the actual value of the indicator is lower than its expected value, the number of instances of the component will continue to decrease, so as to make the actual value of the indicator as close to the expected value as possible. When the number of instances is equal toand the minimum number of instances is, the actual value of the indicator is still not close to the expected value. , then the number of instances is fixed atand the minimum number of instances is, and will not continue to decrease.
index
Currently, Rainbond only supports resource metrics, namely CPU usage, CPU usage, Memory usage and Memory usage. The unit of CPU usage is m, 1m is equal to thousand points One core. The unit of memory usage is Mi.
Indicators support adding and deleting, following the rules below:
- There can only be one indicator about CPU, namely
CPU usage,CPU usagetwo indicators cannot coexist. The same is true for memory. - There is at least one indicator, i.e. all indicators cannot be deleted.
- The indicator value must be an integer greater than 0.
The modification of the above three types of parameters does not need to update or restart the components, and the modification will take effect immediately after successful modification.
a demo example
Create component hpa-example
To demonstrate the horizontal autoscaling of components, we will use a custom docker image based on the php-apache image. The content of the Dockerfile is as follows:
FROM php:5-apache
ADD index.php /var/www/html/index.php
RUN chmod a+rx index.php
It defines an index.php page that performs some very CPU intensive calculations:
<?php
  $x = 0.0001;
  for ($i = 0; $i <= 1000000; $i++) {
    $x += sqrt($x);
  }
  echo "OK!";
?>
You can build an image according to the above Dockerfile, or you can use the image we prepared abewang/hpa-example:latest. We use this image to create a component with a memory limit of 128M and a port of 80.
Configure auto scaling
We set the maximum number of instances to 10, the minimum number of instances to 1, and the CPU usage to be 50%. Roughly speaking, HPA will (through deployment) increase or decrease the number of replicas to maintain the average CPU usage across all pods at 50% . As shown below:
We use the command line to check the current status of hpa:
root@r6dxenial64:~# kubectl get hpa --all-namespaces
NAMESPACE NAME REFERENCE TARGETS MINPODS MAXPODS REPLICAS AGE
6b981574b23d4073a226cf95faf497e3 a737ffa9edca436fadb609d5b3dab1bd Deployment/5a8e8667d96e194be248f2856dcaedda-deployment 1%/40% 1 10 1 1h
increase the load
Now, we open a Linux terminal and send messages to the php-apache service in an infinite loop.
# Please replace http://80.grcaedda.eqfzk1ms.75b8a5.grapps.cn with your actual domain name
while true; do wget -q -O- http://80.grcaedda.eqfzk1ms.75b8a5.grapps.cn ; done
After a minute, we check the status of hpa with the following command:
root@r6dxenial64:~# kubectl get hpa --all-namespaces
NAMESPACE NAME REFERENCE TARGETS MINPODS MAXPODS REPLICAS AGE
6b981574b23d4073a226cf95faf497e3 a737ffa9edca436fadb609d5b3dab1bd Deployment/5a8e8667d96e194be248f2856dcaedda-deployment 270%/40% 1 10 1 1h
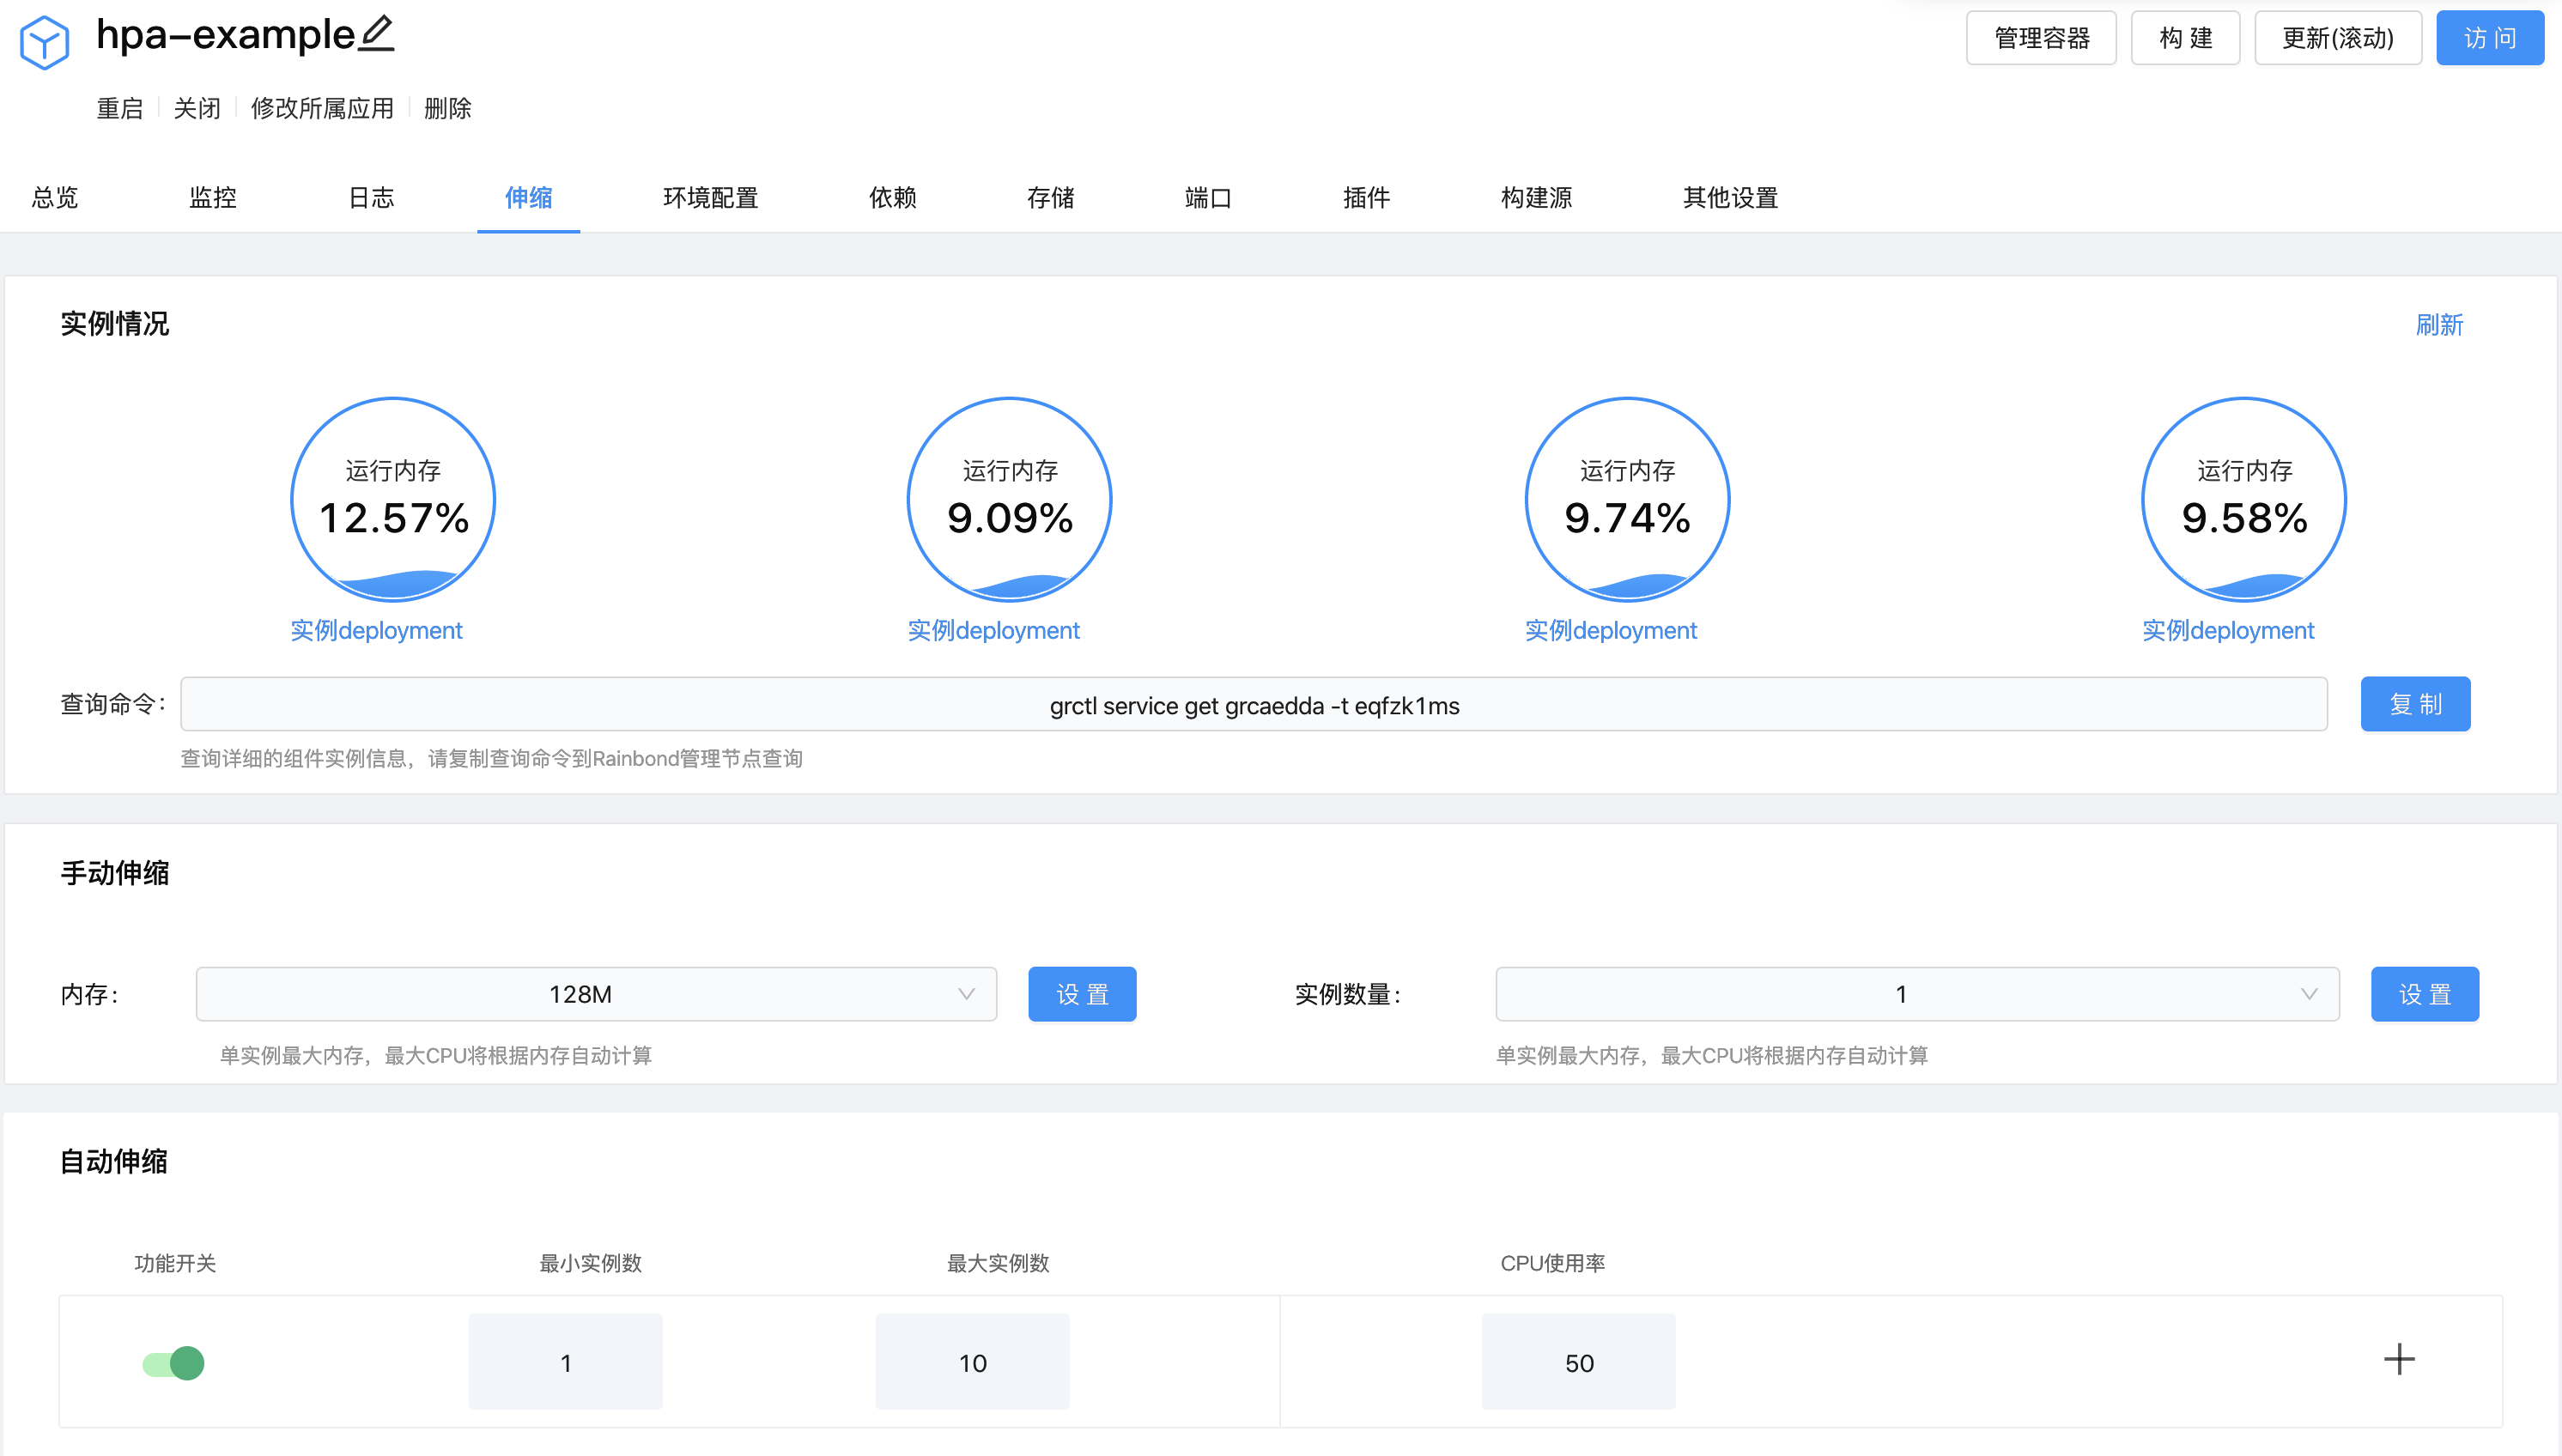
It can be seen that the CPU usage has risen to 270%. This has caused the number of instances to be increased to 4. As shown in the following figure:
reduce load
Now, we stop the above infinite loop running in the Linux terminal to reduce the load on the components. Then, let's check the status of hpa, as follows:
root@r6dxenial64:~# kubectl get hpa --all-namespaces
NAMESPACE NAME REFERENCE TARGETS MINPODS MAXPODS REPLICAS AGE
6b981574b23d4073a226cf95faf497e3 a737ffa9edca436fadb609d5b3dab1bd Deployment/5a8e8667d96e194be248f2856dcaedda-deployment 3%/50% 1 10 1 1h
CPU usage dropped to 0, so the number of instances scaled to 1.
Horizontal scaling record
Let's observe the horizontal scaling record of the component to see what happens in this process. As shown in the following figure:
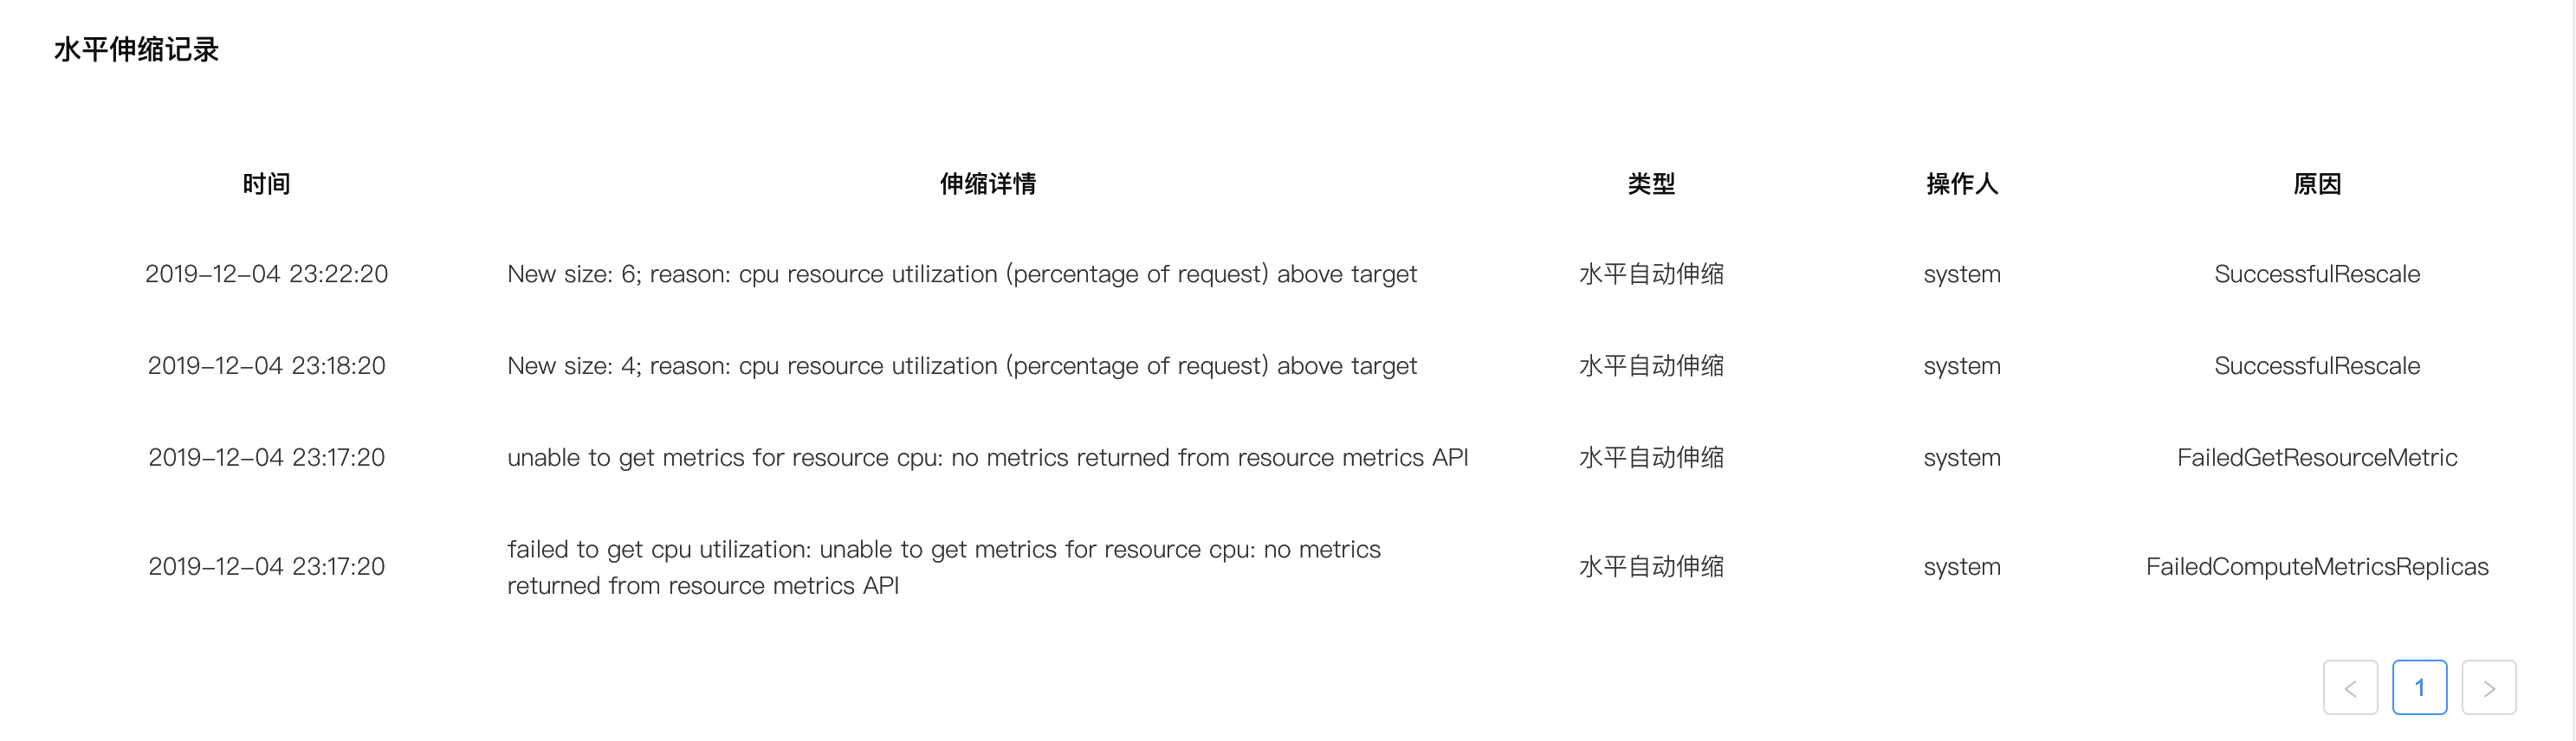
After we configure the relevant parameters, the horizontal auto-scaling starts to take effect, but the indicator is not ready at this time, so we see two records of failure to obtain the indicator. After we send messages to the component in an infinite loop, the horizontal auto-scaling It is checked that the CPU usage exceeds the target value, and the number of instances is scaled to 4, and then to When we stop sending messages, the load goes down, and the horizontal auto-scaling checks that the CPU usage is lower than the target value, and directly scales the instance The number is stretched to 1.
Rainbond records the instance change process of components, so that operation and maintenance personnel can view the instance changes of components at any time.